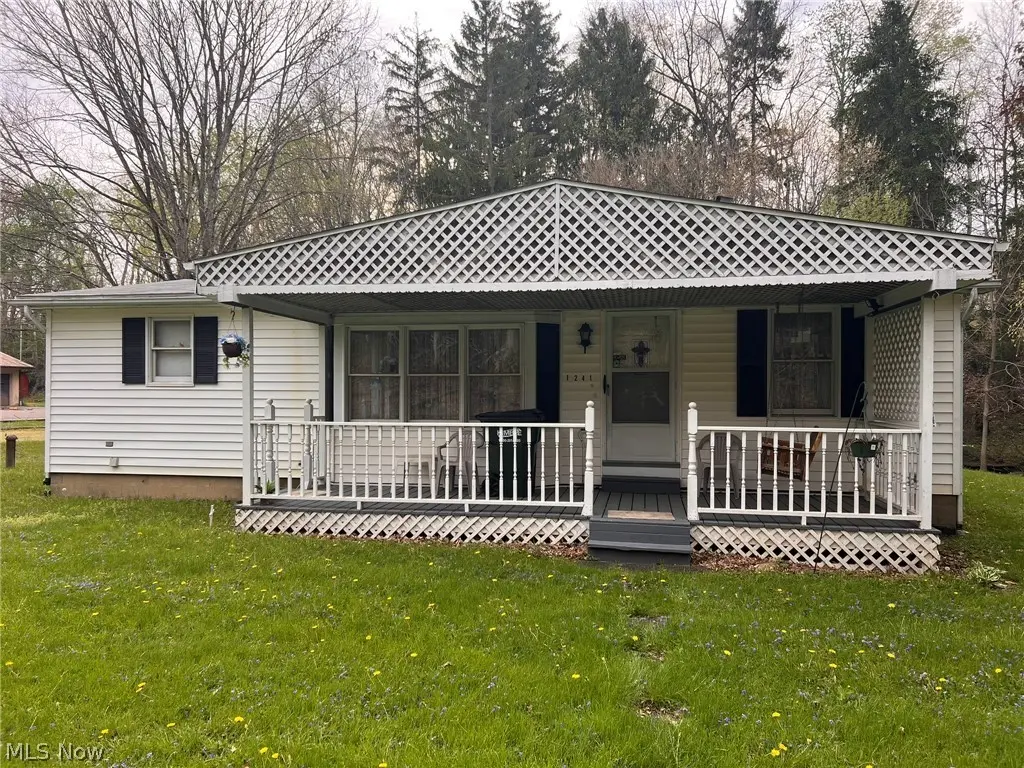
1241 Bison St NW · Massillon, OH
Flood risk 9/10 · Severe
- FEMA flood zone
- X (unshaded)
- Chance of flooding over 30 yrs
- 0.99%
- Est. flood insurance / yr
- $473 – $860
Fire risk 1/10 · Minimal
- Est. fire insurance / yr
- $713 – $1,323
Heat risk 3/10 · Minor
- Hot days now (above 97°F)
- 7 days/yr
- Hot days in 30 yrs
- 17 days/yr
Wind risk 1/10 · Minimal
- Chance of severe wind over 30 yrs
- —
Air-quality risk 2/10 · Minimal
- Unhealthy air days now
- 0 days/yr
- Unhealthy air days in 30 yrs
- 1 days/yr
Risk factors via First Street. Map © Google.
Why this score? — see what drove the D+ grade
The composite is a weighted blend of 9 inputs, each scored 0–100. Each bar is that input's sub-score; the figure is the points it added to the 100-point composite (weight × sub-score).
- Cash flow +13.1/30.0
- ARV discount +12.9/15.0
- Schools +4.0/10.0
- DSCR +3.9/10.0
- Livability +3.7/5.0
- 1% rule +2.7/10.0
- Rent growth +2.5/5.0
- Condition / age +2.5/5.0
- Appreciation +0.0/10.0
$170,000
🖨 Deal sheet (PDF) 📄 Offer letter ✓ Due diligence
Listing remarks
Welcome to 1241 Bison St. This two bedroom, two bathroom home sits on just over an acre of land. The lot is divided into two sections, the front portion offers lawn space, complete with fenced in dog yard. The back section of the lot, which is separated by a stream flowing through the yard, features a wooded hillside which has endless possibilities for the nature lover. The spacious two car garage has a mechanics pit. The interior of the home, features built-in drawers in the dining room and bedroom, along with a bult-in eat in bar. The family room offers a connection and chimney for a wood burning stove to be placed for winter time heating. The unfinished basement has updated HVAC and wate
Key facts
- Built-in drawers
- Mechanics pit
- Wooded hillside
Tags
Property features AI
Finance
- Other: Above-grade finished area reported as 1,452 (per public records)
Exterior
- Parking: Driveway; Attached 2-car garage
- Utilities: Public sewer; Public water and well
- Home design: Single-story home; Wood siding; Shingle roof
- Construction: Built per public records; Wood siding construction; Shingle roof
- Exterior features: Chain link fencing; Approximately 1.18-acre lot
Interior
- Kitchen: Range; Dishwasher; Refrigerator
- Bedrooms: 2 main-level bedrooms
- Bathrooms: 2 full bathrooms (both on the main level)
- Heating & cooling: Gas heating; Central air conditioning
- Interior features: Unfinished basement
- Laundry & utility: Washer; Dryer
Neighborhood map
What this means for you Summary
Snapshot
- This is a 2-bed/2.0-bath single-family listed at $170k.
Deal economics
- At list price, monthly cash flow is $-61 ($-734/yr) — negative.
- To cash-flow at today's rent, offer at most $159k (6.4% below list).
- To meet the 1% rule (rent ≥ 1% of price), the offer needs to be $131k (23.0% below list).
- Recommended offer: $131k (23.0% below list) — sets the bar for 1% rule.
- Cap rate 6.3% vs local median 3.8% in Massillon — top-decile yield for the area; either an underpriced asset or a hidden risk that comps aren't pricing in. Stress-test before assuming the spread holds.
Location & tenants
- Location reads 74/100 on livability (#306 in OH, #4,928 nationally) — a middle-class / working-renter tenant base. Strengths: cost of living A+, housing A+, health & safety A-; Watch: employment C-, amenities F, commute F.
- Massillon City (urban): math 43% / reading 52% proficiency, ranked #487 of 656 in OH (top 74%) — families likely to look elsewhere, expect single-tenant / working-renter base with shorter leases; 60% free/reduced lunch — lower-income household profile, screen leases tightly.
- Zoned schools: Gorrell Elementary School (math 52% / reading 42%, grade D-, #942 of 1,584 statewide, top 61%, 408 students, 0% FRL); Massillon Intermediate School (math 38% / reading 51%, grade D, #477 of 654 statewide, top 74%, 880 students, 0% FRL); Washington High School (math 30% / reading 59%, grade F, #470 of 781 statewide, top 62%, 1,179 students, 0% FRL) — zoned schools average 0% FRL vs 60% district-wide (60 pts lower); this property's tenant base skews higher-income than the district average.
- Market conditions: 103 active listings in the ZIP; 1 comparable units currently listed for rent nearby; 528 units permitted in Stark County in 2024 (84 in 5+ unit buildings).
Forward outlook
- Local home prices are declining (-3.0%/yr); year-one equity from $1k of loan paydown is wiped out by about $5k of value loss. Plan a longer hold.
- Stark County population projected to shrink 8% by 2050 — rents likely to lag national; underwrite the cash flow, not the appreciation.
Negotiation context
- Only 4 days on market — expect competitive offers; lowballing is unlikely to land.
Risks & watch-outs
- Watch-outs: flood insurance adds $56/mo.
- Climate carrying-cost: severe flood risk — expect insurance premiums to compound above CPI over the hold.
Questions for the listing agent
- What do current leases actually rent for vs. the listed asking? Can we see a recent rent roll and the last 12 months of T-12 income?
- What's the actual annual flood-insurance premium (NFIP or private), and is the property in a SFHA with mandatory coverage?
- Is there a deadline driving the sale (1031 exchange, divorce, estate, relocation)? That informs how much negotiation room exists.
- Schools are B-rated — typically a magnet for longer-tenancy family renters. What's the average tenant stay here, and is there a school-zone premium baked into asking?
- The area grade is low — what's the realistic commute time and amenity access for the typical tenant pool here? Any planned neighborhood developments (good or bad) we should know about?
- What's the average days-on-market for RENTAL listings here right now (not sales)? A rising rental-DOM trend means longer vacancies and softer asking-rent achievability than the comps imply.
- What's the recent tenant-quality profile in this submarket — average credit score on applications, eviction rate, late-payment / NSF rate, and stable-employment percentage? A property-management company in the area should have these aggregated.
- How much new for-sale + rental construction is in the pipeline within 1–3 miles? Heavy new supply typically softens prices + rents 12–24 months out; constrained supply supports both.
Investment metrics
- 1% rule
- 0.77% ✗
- Cap rate
- 6.25%
- Cash-on-cash
- -0.14%
- DSCR
- 0.99
- GRM
- 10.8
CMA / ARV
- ARV (median comp)
- $193,321
- List price
- $170,000
- Delta
- -12.06%
- Verdict
- UNDERPRICED
- Comps
- 20 within 1.0 mi
Show comp detail 12 sales within ~0.75 mi
| Address | Dist | Beds/Ba | Sqft | Sold | Price | $/sf | Match |
|---|---|---|---|---|---|---|---|
| 1303 Bison St NW | 0.08mi | 3/2.0 (+1) | 1,456 (+0%) | 5mo | $185,000 | $127 | 87 |
| 600 24th St NW | 0.30mi | 3/1.0 (+1) | 1,448 (-0%) | 13mo | $200,000 | $138 | 66 |
| 578 25th St NW | 0.25mi | 3/2.5 (+1) | 1,368 (-6%) | 9mo | $222,000 | $162 | 64 |
| 586 23rd St NW | 0.34mi | 3/2.0 (+1) | 1,588 (+9%) | 3mo | $249,900 | $157 | 61 |
| 2903 Poplar St NW | 0.40mi | 3/1.5 (+1) | 1,324 (-9%) | 2mo | $260,000 | $196 | 58 |
| 10880 Singer St NW | 0.31mi | 3/2.0 (+1) | 1,612 (+11%) | 9mo | $249,000 | $154 | 55 |
| 811 30th St NW | 0.62mi | 3/2.0 (+1) | 1,416 (-2%) | 13mo | $195,000 | $138 | 51 |
| 313 23rd St NW | 0.60mi | 3/1.5 (+1) | 1,377 (-5%) | 8mo | $216,000 | $157 | 50 |
| 462 Ford St NW | 0.55mi | 3/2.0 (+1) | 1,264 (-13%) | 1mo | $231,000 | $183 | 47 |
| 860 17th St NW | 0.73mi | 3/2.0 (+1) | 1,339 (-8%) | 7mo | $200,000 | $149 | 42 |
| 322 21st St NW | 0.73mi | 3/2.0 (+1) | 1,248 (-14%) | 1mo | $203,367 | $163 | 37 |
| 350 26th St NW | 0.65mi | 3/1.5 (+1) | 1,252 (-14%) | 10mo | $169,900 | $136 | 32 |
Match score weights: distance 35% · size 25% · config 20% · recency 20%. Top-matched comps best support the ARV.
Projected returns pro-forma
-3.0% appreciation · 3.0% rent growth · sell at horizon
- IRR
- -18.9%
- Equity multiple
- 0.34×
- Total profit
- $-31,470
- Equity at exit
- $25,348
- IRR
- -11.4%
- Equity multiple
- 0.32×
- Total profit
- $-32,533
- Equity at exit
- $14,698
Cash invested: $47,600 (down + closing). Projections, not guarantees.
Landlord ↔ Tenant lean methodology
- Overall (STATE)
- 73 Landlord-Friendly
- State Ohio
- 73 Landlord-Friendly · R+6
- County
- — inherits STATE
- City
- — inherits STATE
ZIP-level market 44647
- Active inventory
- 103
- Price-to-rent
- 10.8×
Monthly cashflow live
- Estimated rent
- $1,310 medium interval (Pro) →
- Mortgage (P&I)
- −$891
- Tax from tax record
- −$78 /mo · $936/yr
- Insurance
- −$71
- Flood insurance flood zone
- −$56 /mo · $666/yr
- HOA
- −$0
- Vacancy / Maint / Mgmt
- −$275
- Net cashflow
- $-61
Break-even live
Sensitivity live
| Price | -10% $35 | -5% $-13 | +0% $-61 | +5% $-109 | +10% $-157 |
|---|---|---|---|---|---|
| Rent | -10% $-165 | -5% $-113 | +0% $-61 | +5% $-9 | +10% $42 |
| Rate | -1.0pp $24 | -0.5pp $-18 | base $-61 | +0.5pp $-105 | +1.0pp $-150 |
UW: 25.0% down · 7.5% · 30yr · 1.5% tax · 5.0% vac · 8.0% maint · 8.0% mgmt
Financing live
Cash to close
- Down payment
- $42,500
- Closing costs
- $5,100
- Reserves months
- —
- Total cash needed
- —
Loan-product check · same deal, 3 products live
Conventional
25% down · 7.5% · 30yr
- Down + closing
- —
- Monthly P&I
- —
- Monthly cashflow
- —
- DSCR
- —
- Eligible?
- —
Personal DTI + credit; lowest rate.
DSCR
20% down · 8.5% · 30yr
- Down + closing
- —
- Monthly P&I
- —
- Monthly cashflow
- —
- DSCR
- —
- Eligible?
- —
No personal income docs; deal must DSCR.
Hard money
10% down · 12.0% · 12mo
- Down + closing
- —
- Monthly P&I
- —
- Monthly cashflow
- —
- DSCR
- —
- Eligible?
- —
Short-term bridge; refi at stabilization.
Rent comps 1 comps
| Address | Beds | Baths | Sqft | Rent | $/sqft | DOM | Units | Dist |
|---|---|---|---|---|---|---|---|---|
| 717 15th St SW Massillon, OH | 3.0 | 1.0 | 936 | $1,250 | $1.34 | 45d | 1 | 1.24mi |
Listing history 2 events
-
2026-05-05status Pending 922-char remark
-
2026-05-01$170,000 Active 922-char remark
ⓘ Source: listings_history table (triggers on properties + properties_extension) + one-shot
backfill from property_details.listing_events for pre-trigger history.
Tax reassessment forecast OH · Partial reset (capped growth)
- Current annual tax
- $936 · $78/mo
- Projected year-2 tax
- $1,794 · $150/mo
- Expected delta
- +$858/yr (+$71/mo · 91.6%)
ⓘ Screening estimate from a state-policy table — verify with the county assessor before closing.
Climate risk First Street
- Flood 9/10 Extreme FEMA zone X (unshaded) · 99% chance over 30 yrs
- Wildfire 1/10 Low
- Heat 3/10 Moderate 7 d/yr ≥97°F today · 17 d/yr by 30 yrs out
- Wind 1/10 Low
- Air quality 2/10 Low 0 unhealthy d/yr today · 1 by 30 yrs out
Nearby sold comps map
Loading sold comps map…
Walkable amenities ~0.75 mi
Loading nearby amenities…
Taxation est. · year 1
- Rental income
- $15,718
- − Mortgage interest
- −$9,523
- − Property taxes
- −$936
- − Insurance
- −$1,516
- − Repairs & maintenance
- −$1,257
- − Management
- −$1,257
- − Depreciation
- −$4,945
- Taxable loss
- −$3,718
- Est. tax savings @ 24.0%
- +$892
- After-tax cash flow
- $159/yr
For passive investors: Depreciation is non-cash, so a rental often shows a tax loss while cash-flowing — sheltering income. Rental losses are passive: they offset passive income freely, and up to $25,000/yr can offset ordinary (W-2) income if you actively participate and your MAGI is under $100k (phasing out to $0 by $150k); unused losses carry forward. On sale, claimed depreciation is recaptured at up to 25%, and gains may owe capital-gains tax (a 1031 exchange can defer both). Figures are a year-1 estimate at your 24.0% rate — not tax advice; consult a CPA.
Schools (NCES district)
- District
- Massillon City
- NCES district ID
- 3904435
- Math proficiency
- 43% ▼ -14.00%
- Reading proficiency
- 52% ▼ -11.00%
- Median HH income
- $38,094
- Composite
- 39.54/100
- National rank
- #3941
- State rank
- #487 of 656 in OH
Livability — Massillon
- Score
- 74/100
- State rank
- #306
- US rank
- #4928
Category grades
Schools grade is shown separately in the Schools card above.
Census & demographics
- County
- Stark County · 272,865 people
- City population
- 65,858
- Metro
- Canton-Massillon, OH
- Population (ZIP)
- 18,117
- Household income
- $67,140
- Rent vs Own
- Severe rent burden
- 231.0
Population outlook (Stark County) Hauer SSP2
- Today (2025)
- 373,708 people
- By 2030
- 371,245 · -0.7%
- By 2040
- 361,331 · -3.3%
- By 2050
- 345,290 · -7.6%
- By 2075
- 302,669 · -19.0%
- By 2100
- 238,870 · -36.1%
Race, ethnicity, and origin ACS 2023
- Neighborhood character
- Predominantly White (93%)
- Race & ethnicity
- White 93% Two or more races 4% Hispanic / Latino 2% Black 1%
- Common ancestry
- Romanian 3% Lithuanian 2% Slovak 2%
- Foreign-born
- 1% · Canada
- Languages at home
- 97% English-only · Spanish 1% Arabic 1%
Political lean MEDSL · Stark
- 2024 margin
- Strong R (+21.9) · D 38.6% · R 60.5%
- 2008→2024 swing
- -27.4pp toward R · 2008: 5.5pp · 2024: -21.9pp
- All cycles
- 2024: R+21.9 2020: R+18.5 2016: R+17.4 2012: R+0.4 2008: D+5.5
Not yet ingested
- Civics
- —
Market trends
- HPI YoY
- ▼ -163.61%
- Current HPI
- 207.6115
- Rent YoY
- —
- Metro
- Canton-Massillon, OH
- State GDP YoY
- ▲ 1.98%
- F500 in state
- 48
Industry mix (Fortune 500 HQ in OH)
| Industry | F500 HQs | Revenue |
|---|---|---|
| Insurance | 3 | $145B |
|
||
| Industrial Machinery | 3 | $49B |
|
||
| Financial Services | 3 | $24B |
|
||
| Consumer Goods | 2 | $93B |
|
||
| Aerospace / Defense | 2 | $47B |
|
||
| Utilities | 2 | $33B |
|
||
Price history
+21.8% since first listed4 events — show timeline
- 2026-06-04 Sold (Public Records) $207,000 Public Records
- 2026-06-04 Sold (MLS) $207,000 MLSNOW
- 2026-05-05 Pending — MLSNOW
- 2026-05-01 Listed $170,000 MLSNOW
Property tax history
-1.5%/yrLatest (2024): $936 · +367.5% YoY. Source: county tax records.
Cash-flow waterfall
monthlySold comps — $/sqft
last 12 mo · ≤1 miLoading sold comps…