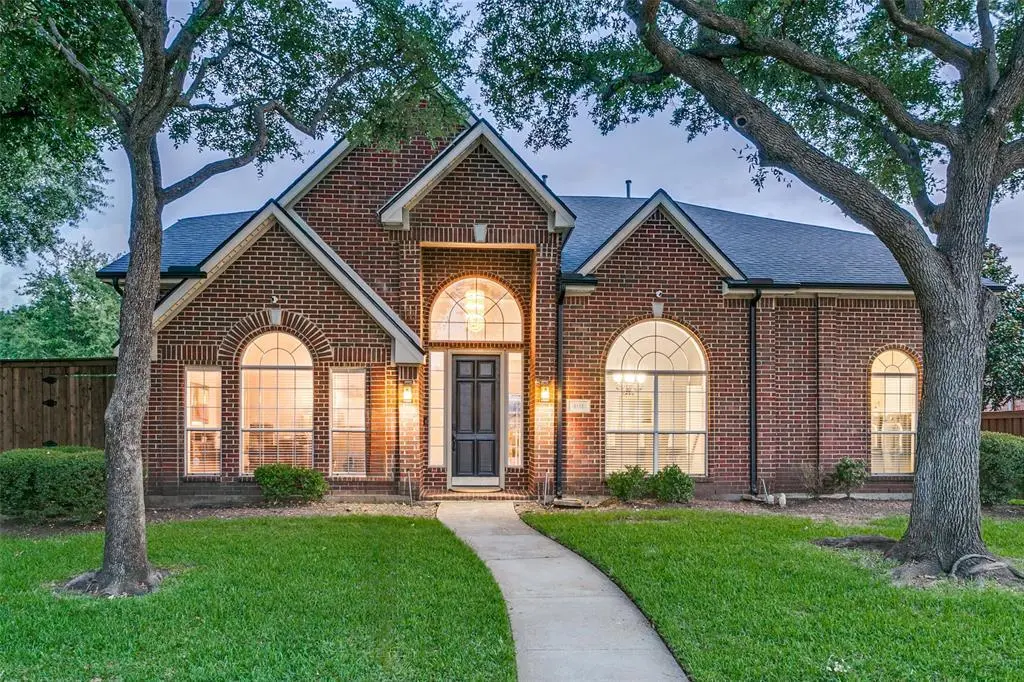
401 Marlow Dr
Flower Mound, TX 75028
$620,000C
4 bd · 2.0 ba ·
2,904 sqft ·
Built 1995
· SingleFamily
· Active
· 10 DOM
Cashflow @ list (25.0% down · 7.5%)
Estimated rent
$7,011/mo
Mortgage (P&I)
−$3,251
Tax + insurance
−$1,051
HOA
−$27
Vac / Maint / Mgmt
−$1,472
Net cashflow
$1,209/mo
Annual
$14,514/yr
Cap rate
8.63%
Cash-on-cash
8.36%
DSCR
1.37
1% rule
1.13%
Cash to close
$173,600
Investor read
- This is a 4-bed/2.0-bath single-family listed at $620k.
- At list price, monthly cash flow is $1k ($15k/yr) — positive.
- The deal already cash-flows at list — no discount required.
- Meets the 1% rule at list price ($7k rent vs $620k).
- Only 10 days on market — expect competitive offers; lowballing is unlikely to land.
- Local home prices are declining (-3.0%/yr); year-one equity from $4k of loan paydown is wiped out by about $19k of value loss. Plan a longer hold.
- Location reads 71/100 on livability (#317 in TX) — a middle-class / working-renter tenant base. Strengths: crime A+, employment A+, housing A+; Watch: amenities F, commute F, cost of living F.
- Lewisville ISD (suburban): math 49% / reading 54% proficiency, ranked #109 of 826 in TX (top 13%) — acceptable for families but not a draw, mixed tenant base, ~2y average lease.
- Zoned schools: Garden Ridge El (math 62% / reading 62%, grade B, #321 of 4,322 statewide, top 8%, 380 students, 25% FRL) — zoned schools at 25% FRL track the district average.
- Market conditions: Rents soft (-0.2%/yr); 270 active listings in the ZIP; 22 comparable units currently listed for rent nearby; rentals at typical pace (median 25d on market — plan ~3-4 weeks tenant-placement turnaround); 45% of comp listings sitting > 30 days — soft ceiling on asking rent; high-income renter base; 10,531 units permitted in Denton County in 2024 (2,713 in 5+ unit buildings).
- Denton County population projected at +66% by 2050 — long-run rental-demand tailwind backs the buy-and-hold thesis.
- 3 sale attempts since 22y ago with the ask held roughly flat each time — persistent listings suggest the price (not the market) is what's stuck; bring a comps-based counter.
- Current owner paid $238k; list at $620k implies a 161% gain — meaningful room to come down on a strong offer.
- Climate carrying-cost: moderate wind risk, 26% chance of damaging wind over 30y; extreme-heat days projected 7→22/yr by 2055 (HVAC capex compounding) — expect insurance premiums to compound above CPI over the hold.
- Cap rate 8.6% vs local median 2.5% in Flower Mound — top-decile yield for the area; either an underpriced asset or a hidden risk that comps aren't pricing in. Stress-test before assuming the spread holds.
- At $7,011/mo this rent would consume 56% of the median local household income ($149k/yr) (locally 779% of renters already pay >50% of income on rent) — very limited rent-growth headroom before tenants either downsize or default.
Questions for listing agent
- What does the HOA fee cover, when was the last increase, and are there any pending special assessments or reserve-fund shortfalls?
- Is there a deadline driving the sale (1031 exchange, divorce, estate, relocation)? That informs how much negotiation room exists.
- Schools are A-rated — typically a magnet for longer-tenancy family renters. What's the average tenant stay here, and is there a school-zone premium baked into asking?
- What's the average days-on-market for RENTAL listings here right now (not sales)? A rising rental-DOM trend means longer vacancies and softer asking-rent achievability than the comps imply.
- What's the recent tenant-quality profile in this submarket — average credit score on applications, eviction rate, late-payment / NSF rate, and stable-employment percentage? A property-management company in the area should have these aggregated.
- How much new for-sale + rental construction is in the pipeline within 1–3 miles? Heavy new supply typically softens prices + rents 12–24 months out; constrained supply supports both.
CashFlowRE · CFR-9Y54RWE5VC8VJ6
· Data 2 days ago
cashflowre.app · 2026-05-29