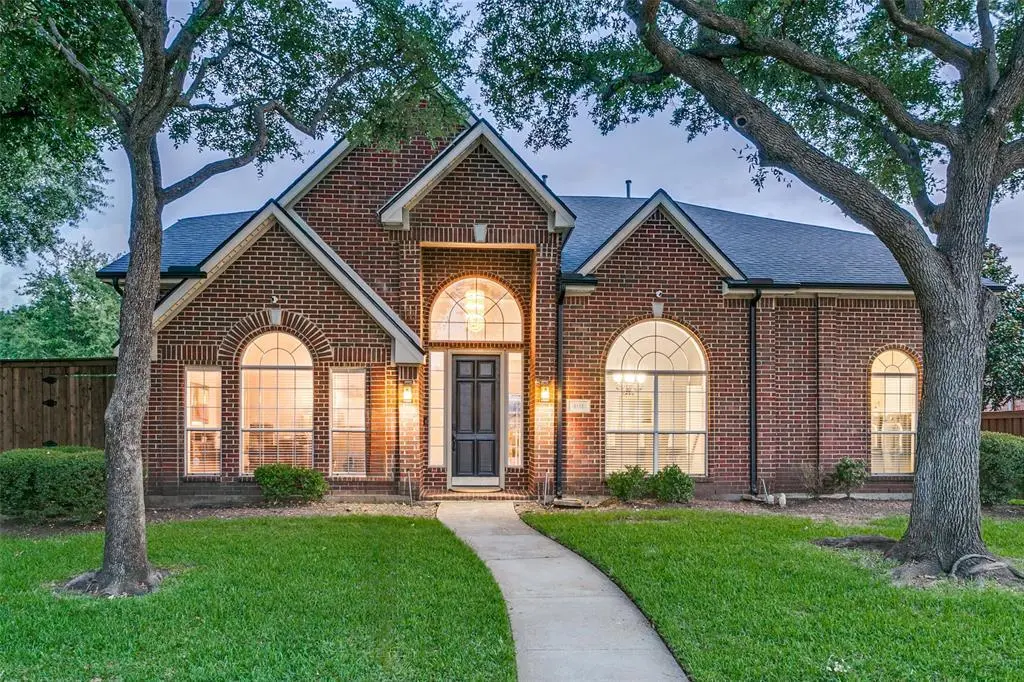
401 Marlow Dr · Flower Mound, TX
Flood risk 1/10 · Minimal
- FEMA flood zone
- X (unshaded)
- Chance of flooding over 30 yrs
- 0.0%
- Est. flood insurance / yr
- $507 – $1,088
Fire risk 4/10 · Minor
- Est. fire insurance / yr
- $1,222 – $2,270
Heat risk 7/10 · Major
- Hot days now (above 109°F)
- 7 days/yr
- Hot days in 30 yrs
- 22 days/yr
Wind risk 5/10 · Moderate
- Chance of severe wind over 30 yrs
- 26.0%
Air-quality risk 3/10 · Minor
- Unhealthy air days now
- 3 days/yr
- Unhealthy air days in 30 yrs
- 4 days/yr
Risk factors via First Street. Map © Google.
Why this score? — see what drove the C grade
The composite is a weighted blend of 9 inputs, each scored 0–100. Each bar is that input's sub-score; the figure is the points it added to the 100-point composite (weight × sub-score).
- Cash flow +24.0/30.0
- DSCR +7.7/10.0
- 1% rule +6.3/10.0
- ARV discount +5.9/15.0
- Schools +4.7/10.0
- Livability +3.6/5.0
- Condition / age +2.5/5.0
- Rent growth +2.4/5.0
- Appreciation +0.0/10.0
$620,000
🖨 Deal sheet 📄 Offer letter ✓ Due diligence
Listing remarks MLS
Custom Home with many updates! Designer paint throughout 07. Plantation shutters, marble floors in master bath and kitchen. Venetian plaster in master and guest bath. Skip trowel finish in kitchen and 1st floor guest bath. Updated kitchen counters and back splash 07. Replaced Microwave and dishwasher 08. Finished bonus room. Updated fixtures and faucets. Gunite pool & spa W-5 ft. safety fence. This home is move in ready.
Key facts
- Expansive yard
- New upstairs carpet
- Heated pool
Tags
Property features AI
Finance
- Other: No horse permitted; Subdivision: Willow Ridge Estate; County: Denton
- HOA & community: Mandatory HOA; HOA fee $160 semi-annually; HOA covers grounds maintenance
Exterior
- Parking: Attached 2-car garage; 2 covered parking spaces; Additional parking and driveway; garage faces rear
- Utilities: City water; City sewer; Co-op electric
- Home design: Single family residence (attached); Two-story; Built in 1995
- Construction: Brick construction; Shingle roof; Slab foundation
- Exterior features: Private yard; Patio; Gutters; Shed(s); Fenced yard with wood privacy/high fence; Landscaped grounds; Large backyard with grass; Sprinkler system; Interior lot with few trees
Interior
- Kitchen: Natural stone/granite counters; Built-in cabinets; Eat-in kitchen; Water line to refrigerator; Dishwasher; Disposal; Electric oven; Electric range; Microwave
- Bedrooms: 4 bedrooms total; Primary bedroom on main level with ensuite bath, dual sinks and walk-in closet; Three bedrooms upstairs with walk-in closets
- Flooring: Carpet; Luxury vinyl plank
- Bathrooms: 2 full bathrooms; 1 half bathroom
- Heating & cooling: Central heating; Fireplace(s) for supplementary heat; Central air; Ceiling fan(s)
- Interior features: Open floorplan; Eat-in kitchen; Pantry; Walk-in closets; Decorative lighting; Cable TV available; Flat screen wiring; Plantation shutters; 12 total rooms; Two levels; Two living areas; Two dining areas
- Laundry & utility: Utility room; Washer hookup
Neighborhood map
What this means for you Summary
Snapshot
- This is a 4-bed/2.0-bath single-family listed at $620k.
Deal economics
- At list price, monthly cash flow is $1k ($15k/yr) — positive.
- The deal already cash-flows at list — no discount required.
- Meets the 1% rule at list price ($7k rent vs $620k).
- Cap rate 8.6% vs local median 2.5% in Flower Mound — top-decile yield for the area; either an underpriced asset or a hidden risk that comps aren't pricing in. Stress-test before assuming the spread holds.
Location & tenants
- Location reads 71/100 on livability (#317 in TX) — a middle-class / working-renter tenant base. Strengths: crime A+, employment A+, housing A+; Watch: amenities F, commute F, cost of living F.
- Lewisville ISD (suburban): math 49% / reading 54% proficiency, ranked #109 of 826 in TX (top 13%) — acceptable for families but not a draw, mixed tenant base, ~2y average lease.
- Zoned schools: Garden Ridge El (math 62% / reading 62%, grade B, #321 of 4,322 statewide, top 8%, 380 students, 25% FRL) — zoned schools at 25% FRL track the district average.
- Market conditions: Rents soft (-0.2%/yr); 270 active listings in the ZIP; 22 comparable units currently listed for rent nearby; rentals at typical pace (median 25d on market — plan ~3-4 weeks tenant-placement turnaround); 45% of comp listings sitting > 30 days — soft ceiling on asking rent; high-income renter base; 10,531 units permitted in Denton County in 2024 (2,713 in 5+ unit buildings).
- At $7,011/mo this rent would consume 56% of the median local household income ($149k/yr) (locally 779% of renters already pay >50% of income on rent) — very limited rent-growth headroom before tenants either downsize or default.
Forward outlook
- Local home prices are declining (-3.0%/yr); year-one equity from $4k of loan paydown is wiped out by about $19k of value loss. Plan a longer hold.
- Denton County population projected at +66% by 2050 — long-run rental-demand tailwind backs the buy-and-hold thesis.
Negotiation context
- Only 10 days on market — expect competitive offers; lowballing is unlikely to land.
- 3 sale attempts since 22y ago with the ask held roughly flat each time — persistent listings suggest the price (not the market) is what's stuck; bring a comps-based counter.
- Current owner paid $238k; list at $620k implies a 161% gain — meaningful room to come down on a strong offer.
Risks & watch-outs
- Climate carrying-cost: moderate wind risk, 26% chance of damaging wind over 30y; extreme-heat days projected 7→22/yr by 2055 (HVAC capex compounding) — expect insurance premiums to compound above CPI over the hold.
Questions for the listing agent
- What does the HOA fee cover, when was the last increase, and are there any pending special assessments or reserve-fund shortfalls?
- Is there a deadline driving the sale (1031 exchange, divorce, estate, relocation)? That informs how much negotiation room exists.
- Schools are A-rated — typically a magnet for longer-tenancy family renters. What's the average tenant stay here, and is there a school-zone premium baked into asking?
- What's the average days-on-market for RENTAL listings here right now (not sales)? A rising rental-DOM trend means longer vacancies and softer asking-rent achievability than the comps imply.
- What's the recent tenant-quality profile in this submarket — average credit score on applications, eviction rate, late-payment / NSF rate, and stable-employment percentage? A property-management company in the area should have these aggregated.
- How much new for-sale + rental construction is in the pipeline within 1–3 miles? Heavy new supply typically softens prices + rents 12–24 months out; constrained supply supports both.
Investment metrics
- 1% rule
- 1.13% ✓
- Cap rate
- 8.63%
- Cash-on-cash
- 8.36%
- DSCR
- 1.37
- GRM
- 7.4
CMA / ARV
- ARV (on-the-fly)
- $598,224
- Comps found
- 12
Show comp detail 12 sales within ~0.75 mi
| Address | Dist | Beds/Ba | Sqft | Sold | Price | $/sf | Match |
|---|---|---|---|---|---|---|---|
| 613 Saddleback Ln | 0.39mi | 4/3.0 | 2,819 (-3%) | 1mo | $612,000 | $217 | 72 |
| 2441 Telluride Dr | 0.53mi | 4/2.5 | 2,835 (-2%) | 1mo | $599,900 | $212 | 69 |
| 832 Tealwood Cir | 0.49mi | 4/2.5 | 3,029 (+4%) | 0mo | $650,000 | $215 | 68 |
| 1414 Saddleback Ln | 0.31mi | 4/2.5 | 2,595 (-11%) | 0mo | $499,000 | $192 | 65 |
| 621 Tealwood Ln | 0.31mi | 4/3.0 | 3,200 (+10%) | 1mo | $625,000 | $195 | 64 |
| 1922 Hidden Trail Dr | 0.58mi | 4/2.5 | 2,796 (-4%) | 4mo | $485,000 | $173 | 61 |
| 917 Wood Duck Way | 0.54mi | 4/2.5 | 3,099 (+7%) | 2mo | $635,000 | $205 | 60 |
| 1804 Briaroaks Dr | 0.32mi | 5/3.5 (+1) | 3,129 (+8%) | 3mo | $780,000 | $249 | 59 |
| 1309 Havencreek Cv | 0.48mi | 3/2.5 (-1) | 2,622 (-10%) | 1mo | $539,000 | $206 | 54 |
| 901 Sugarberry Ln | 0.58mi | 4/3.0 | 3,223 (+11%) | 6mo | $624,450 | $194 | 46 |
| 608 Crestbrook Dr | 0.72mi | 5/3.5 (+1) | 3,066 (+6%) | 3mo | $675,000 | $220 | 44 |
| 1148 Pleasant Oaks Dr | 0.70mi | 3/2.0 (-1) | 2,633 (-9%) | 6mo | $464,900 | $177 | 42 |
Match score weights: distance 35% · size 25% · config 20% · recency 20%. Top-matched comps best support the ARV.
Projected returns pro-forma
-3.0% appreciation · 0.0% rent growth · sell at horizon
- IRR
- -7.1%
- Equity multiple
- 0.75×
- Total profit
- $-43,848
- Equity at exit
- $92,444
- IRR
- -1.7%
- Equity multiple
- 0.90×
- Total profit
- $-17,855
- Equity at exit
- $53,606
Cash invested: $173,600 (down + closing). Projections, not guarantees.
Landlord ↔ Tenant lean methodology
- Overall (STATE)
- 87 Strongly Landlord-Friendly
- State Texas
- 87 Strongly Landlord-Friendly · R+5
- County
- — inherits STATE
- City
- — inherits STATE
ZIP-level market 75028
- Home prices YoY
- -27.9%
- Rents YoY
- -0.2%
- Active inventory
- 270
- Price-to-rent
- 7.4×
Monthly cashflow live
- Estimated rent
- $7,011 high interval (Pro) →
- Mortgage (P&I)
- −$3,251
- Tax from tax record
- −$793 /mo · $9,513/yr
- Insurance
- −$258
- HOA
- −$27
- Vacancy / Maint / Mgmt
- −$1,472
- Net cashflow
- $1,209
Break-even live
UW: 25.0% down · 7.5% · 30yr · 1.5% tax · 5.0% vac · 8.0% maint · 8.0% mgmt
Financing live
Cash to close
- Down payment
- $155,000
- Closing costs
- $18,600
- Reserves months
- —
- Total cash needed
- —
Loan-product check · same deal, 3 products live
Conventional
25% down · 7.5% · 30yr
- Down + closing
- —
- Monthly P&I
- —
- Monthly cashflow
- —
- DSCR
- —
- Eligible?
- —
Personal DTI + credit; lowest rate.
DSCR
20% down · 8.5% · 30yr
- Down + closing
- —
- Monthly P&I
- —
- Monthly cashflow
- —
- DSCR
- —
- Eligible?
- —
No personal income docs; deal must DSCR.
Hard money
10% down · 12.0% · 12mo
- Down + closing
- —
- Monthly P&I
- —
- Monthly cashflow
- —
- DSCR
- —
- Eligible?
- —
Short-term bridge; refi at stabilization.
Rent comps 22 comps
| Address | Beds | Baths | Sqft | Rent | $/sqft | DOM | Units | Dist |
|---|---|---|---|---|---|---|---|---|
| 621 Somerset Dr Flower Mound, TX | 4.0 | 3.5 | 3401 | $13,500 | $3.97 | 1d | 1 | 0.50mi |
| 2400 Sweet Grass Trl Flower Mound, TX | 4.0 | 3.5 | 3140 | $4,500 | $1.43 | 5d | 1 | 0.62mi |
| 916 Sugarberry Ln Flower Mound, TX | 3.0 | 2.5 | 2159 | $3,100 | $1.44 | 14d | 1 | 0.62mi |
| 1029 Sugarberry Ln Flower Mound, TX | 5.0 | 3.5 | 2624 | $3,000 | $1.14 | 44d | 1 | 0.69mi |
| 2109 Gisbourne Dr Flower Mound, TX | 4.0 | 2.0 | 2251 | $2,995 | $1.33 | 5d | 1 | 0.83mi |
| 1709 Circle Creek Dr Lewisville, TX | 4.0 | 2.5 | 2107 | $2,699 | $1.28 | 44d | 1 | 0.89mi |
| 2080 Kamla Rd Lewisville, TX | 5.0 | 2.5 | 3113 | $11,750 | $3.77 | 44d | 1 | 0.91mi |
| 2062 Arena Dr Lewisville, TX | 5.0 | 2.5 | 2638 | $8,750 | $3.32 | 24d | 1 | 0.94mi |
| 2062 Arena Dr Unit 1019552P Lewisville, TX | 5.0 | 2.5 | 2637 | $14,416 | $5.47 | 44d | 1 | 0.94mi |
| 2632 Skinner Dr Unit 1019502P Flower Mound, TX | 5.0 | 2.5 | 2411 | $8,135 | $3.37 | 44d | 1 | 1.04mi |
| 2632 Skinner Dr Flower Mound, TX | 5.0 | 2.5 | 2417 | $9,750 | $4.03 | 44d | 1 | 1.04mi |
| 2628 Crepe Myrtle Dr Flower Mound, TX | 4.0 | 2.5 | 2343 | $3,400 | $1.45 | 44d | 1 | 1.10mi |
| 2066 Vista Dr Lewisville, TX | 3.0 | 2.0 | 1966 | $2,400 | $1.22 | 21d | 1 | 1.10mi |
| 923 Granview Dr Lewisville, TX | 4.0 | 2.5 | 2564 | $2,799 | $1.09 | 13d | 1 | 1.18mi |
| 987 Little Den Dr Lewisville, TX | 5.0 | 3.5 | 3881 | $16,000 | $4.12 | 44d | 1 | 1.19mi |
| 987 Little Den Dr Unit 1019519P Lewisville, TX | 5.0 | 3.5 | 3875 | $23,786 | $6.14 | 22d | 1 | 1.19mi |
| 2010 Vista Dr Lewisville, TX | 4.0 | 2.5 | 2973 | $2,790 | $0.94 | 21d | 1 | 1.25mi |
| 2105 Friar Ct Flower Mound, TX | 4.0 | 3.0 | 2976 | $3,250 | $1.09 | 19d | 1 | 1.26mi |
| 2008 Vista Dr Unit 1376585P Lewisville, TX | 4.0 | 2.5 | 2830 | $12,397 | $4.38 | 22d | 1 | 1.26mi |
| 2008 Vista Dr Lewisville, TX | 4.0 | 2.5 | 2838 | $9,750 | $3.44 | 44d | 1 | 1.26mi |
| 1740 Forest Glen Dr Flower Mound, TX | 4.0 | 2.5 | 3150 | $8,000 | $2.54 | 44d | 1 | 1.27mi |
| 2078 Belvedere Dr Lewisville, TX | 3.0 | 2.5 | 2017 | $2,600 | $1.29 | 24d | 1 | 1.38mi |
HOA detail
- Monthly dues
- $27 · $324/yr
- Likely covers
- pool
Listing history 8 events
-
2026-06-18days on market $620,000 Active 10 DOM
-
2026-06-17days on market $620,000 Active 9 DOM
-
2026-06-16days on market $620,000 Active 8 DOM
-
2026-06-15days on market $620,000 Active 7 DOM
-
2026-06-13days on market $620,000 Active 5 DOM
-
2026-06-13days on market $620,000 Active 4 DOM
-
2026-06-08remarks 693-char remark
-
2026-06-08$620,000 Active 1 DOM
ⓘ Source: listings_history table (triggers on properties + properties_extension) + one-shot
backfill from property_details.listing_events for pre-trigger history.
Tax reassessment forecast TX · Resets to sale price
- Current annual tax
- $9,513 · $793/mo
- Projected year-2 tax
- $11,346 · $946/mo
- Expected delta
- +$1,833/yr (+$153/mo · 19.3%)
ⓘ Screening estimate from a state-policy table — verify with the county assessor before closing.
Climate risk First Street
- Flood 1/10 Low FEMA zone X (unshaded) · 0% chance over 30 yrs
- Wildfire 4/10 Moderate
- Heat 7/10 Severe 7 d/yr ≥109°F today · 22 d/yr by 30 yrs out
- Wind 5/10 Major 26% chance of damaging wind over 30 yrs
- Air quality 3/10 Moderate 3 unhealthy d/yr today · 4 by 30 yrs out
Nearby sold comps map
Loading sold comps map…
Walkable amenities ~0.75 mi
Loading nearby amenities…
Taxation est. · year 1
- Rental income
- $84,136
- − Mortgage interest
- −$34,730
- − Property taxes
- −$9,513
- − Insurance
- −$3,100
- − Repairs & maintenance
- −$6,731
- − Management
- −$6,731
- − HOA
- −$324
- − Depreciation
- −$18,036
- Taxable income
- $4,971
- Est. tax owed @ 24.0%
- −$1,193
- After-tax cash flow
- $13,321/yr
For passive investors: Depreciation is non-cash, so a rental often shows a tax loss while cash-flowing — sheltering income. Rental losses are passive: they offset passive income freely, and up to $25,000/yr can offset ordinary (W-2) income if you actively participate and your MAGI is under $100k (phasing out to $0 by $150k); unused losses carry forward. On sale, claimed depreciation is recaptured at up to 25%, and gains may owe capital-gains tax (a 1031 exchange can defer both). Figures are a year-1 estimate at your 24.0% rate — not tax advice; consult a CPA.
Schools (NCES district)
- District
- Lewisville ISD
- NCES district ID
- 4827300
- Math proficiency
- 49% ▼ -10.00%
- Reading proficiency
- 54% ▼ -4.00%
- Median HH income
- $82,351
- Composite
- 47.1/100
- National rank
- #2333
- State rank
- #109 of 826 in TX
Livability — Flower Mound
- Score
- 71/100
- State rank
- #317
- US rank
- #7074
Category grades
Schools grade is shown separately in the Schools card above.
Census & demographics
- Census place
- Flower Mound, TX
- County
- Denton County · 901,654 people
- City population
- 75,184
- Metro
- Dallas-Fort Worth-Arlington, TX
- Population (ZIP)
- 49,094
- Household income
- $149,436
- Rent vs Own
- Severe rent burden
- 779.0
Population outlook (Denton County) Hauer SSP2
- Today (2025)
- 1,053,010 people
- By 2030
- 1,192,269 · +13.2%
- By 2040
- 1,472,920 · +39.9%
- By 2050
- 1,746,506 · +65.9%
- By 2075
- 2,358,497 · +124.0%
- By 2100
- 2,779,183 · +163.9%
Race, ethnicity, and origin ACS 2023
- Neighborhood character
- Predominantly White (68%)
- Race & ethnicity
- White 68% Hispanic / Latino 12% Asian 12% Two or more races 10% Black 4%
- Hispanic origin (detail)
- Mexican 7%
- Common ancestry
- Romanian 3% Slovak 3% Serbian 3%
- Foreign-born
- 14% · Canada, South Korea, China
- Languages at home
- 81% English-only · Spanish 7% Other Asian/Pacific 4% Other Indo-European 3%
Political lean MEDSL · Denton
- 2024 margin
- R (+13.2) · D 42.7% · R 55.8% · Other 1.5%
- 2008→2024 swing
- +11.0pp toward D · 2008: -24.2pp · 2024: -13.2pp
- All cycles
- 2024: R+13.2 2020: R+8.1 2016: R+20.2 2012: R+31.7 2008: R+24.2
Not yet ingested
- Civics
- —
Market trends
- HPI YoY
- ▼ -107.51%
- Current HPI
- 277.7883
- Rent YoY
- ▼ -0.25%
- Metro
- Dallas-Fort Worth-Arlington, TX
- State GDP YoY
- ▲ 3.95%
- F500 in state
- 110
Industry mix (Fortune 500 HQ in TX)
| Industry | F500 HQs | Revenue |
|---|---|---|
| Energy | 16 | $1,198B |
|
||
| Technology | 5 | $198B |
|
||
| Engineering / Construction | 4 | $72B |
|
||
| Energy Services | 3 | $60B |
|
||
| Utilities | 3 | $41B |
|
||
| Healthcare | 2 | $330B |
|
||
Price history
+243.8% since first listed10 events — show timeline
- 2026-06-07 Listed $620,000 NTREIS
- 2008-09-02 Sold (Public Records) — Public Records
- 2008-08-26 Sold (MLS) — NTREIS
- 2008-08-01 Listing Removed — NTREIS
- 2008-06-15 Listed $285,000 NTREIS
- 2004-09-22 Sold (Public Records) $237,900 Public Records
- 2004-09-17 Sold (MLS) — NTREIS
- 2004-09-02 Listing Removed — NTREIS
- 2004-06-28 Listed $239,900 NTREIS
- 1994-12-27 Sold (Public Records) $180,348 Public Records
Property tax history
+3.2%/yrLatest (2025): $9,513 · +5.9% YoY. Source: county tax records.
Cash-flow waterfall
monthlySold comps — $/sqft
last 12 mo · ≤1 miLoading sold comps…