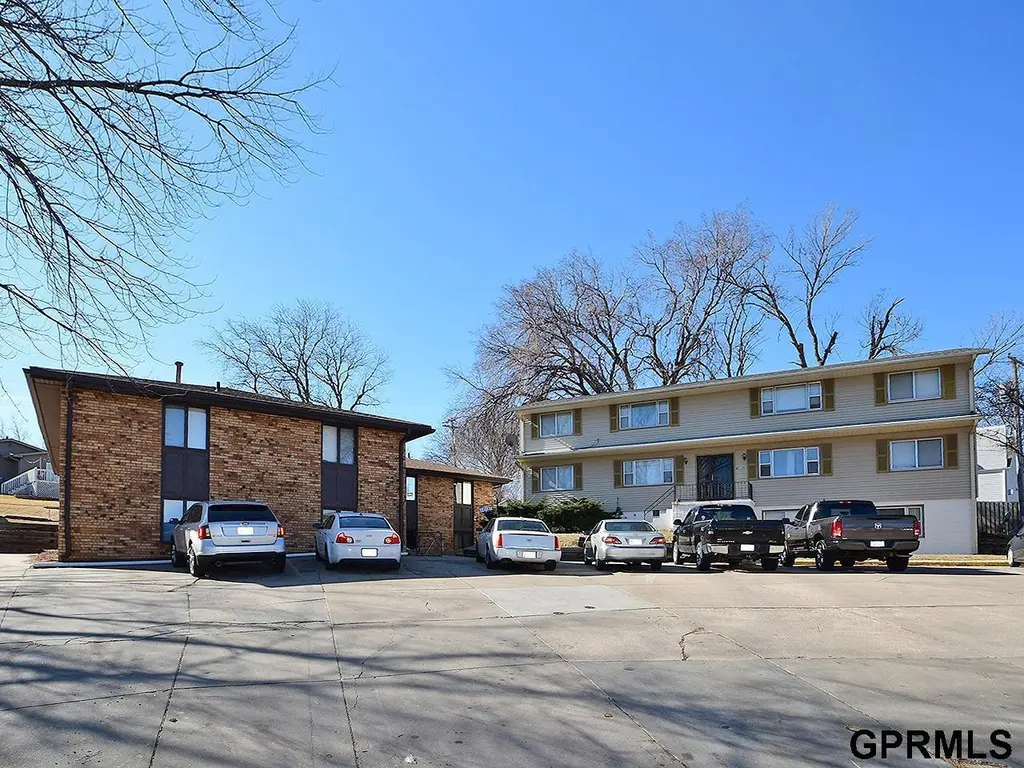
12135 Lisa Cir
Omaha, NE 68137
$1,150,000B
None bd · None ba ·
— sqft ·
Built 1963
· MultiFamily
· Active
· 119 DOM
Cashflow @ list (25.0% down · 7.5%)
Estimated rent
$17,280/mo
Mortgage (P&I)
−$6,031
Tax + insurance
−$1,917
HOA
−$0
Vac / Maint / Mgmt
−$3,629
Net cashflow
$5,704/mo
Annual
$68,446/yr
Cap rate
12.24%
Cash-on-cash
21.26%
DSCR
1.95
1% rule
1.50%
Cash to close
$322,000
Investor read
- This is a multifamily listed at $1.15M. Condition is rated average.
- At list price, monthly cash flow is $6k ($68k/yr) — positive.
- The deal already cash-flows at list — no discount required.
- Meets the 1% rule at list price ($17k rent vs $1.15M).
- It's been on market 119 days — a 9% lower offer ($1.05M) is reasonable based on typical stale-listing flexibility.
- Recommended offer: $1.05M (9.0% below list) — sets the bar for market timing.
- Local home prices are declining (-3.0%/yr); year-one equity from $8k of loan paydown is wiped out by about $34k of value loss. Plan a longer hold.
- Location reads 84/100 on livability (#7 in NE, #663 nationally) — a professional / high-income tenant draw. Strengths: amenities A+, commute A+, cost of living A+; Watch: crime F.
- Millard Public Schools (urban): math 58% / reading 60% proficiency, ranked #13 of 111 in NE (top 12%) — acceptable for families but not a draw, mixed tenant base, ~2y average lease; only 13% free/reduced lunch — higher-income household profile.
- Market conditions: Rents rising (+3.6%/yr); 113 active listings in the ZIP; 15 comparable units currently listed for rent nearby; rentals leasing fast (median 3d on market — plan ~1-2 weeks tenant-placement turnaround); solid renter incomes; 4,539 units permitted in Douglas County in 2024 (2,583 in 5+ unit buildings).
- Douglas County population projected at +28% by 2050 — long-run rental-demand tailwind backs the buy-and-hold thesis.
- At projected returns (-3.0% appreciation + 3.6% rent growth), your $322k cash investment doubles in ~6 years — after that, you're playing with house money.
- Cap rate 12.2% vs local median 3.6% in Omaha — top-decile yield for the area; either an underpriced asset or a hidden risk that comps aren't pricing in. Stress-test before assuming the spread holds.
- At $17,280/mo this rent would consume 257% of the median local household income ($81k/yr) (locally 728% of renters already pay >50% of income on rent) — very limited rent-growth headroom before tenants either downsize or default.
Questions for listing agent
- It's been on market 119 days. Have you received any prior offers? Is the seller open to a 9% concession, seller financing, or rate buy-down credit?
- Built in 1963 — when were the roof, HVAC, electrical panel, plumbing, and water heater last replaced?
- Why hasn't it sold? Are there any deal-killer items the seller is aware of (foundation, flood, title, zoning, code violations)?
- Is there a deadline driving the sale (1031 exchange, divorce, estate, relocation)? That informs how much negotiation room exists.
- Crime grade is F in this area — have there been break-ins, vandalism, or insurance claims at this property in the last 3 years? What carrier currently insures it and at what premium?
- What's the average days-on-market for RENTAL listings here right now (not sales)? A rising rental-DOM trend means longer vacancies and softer asking-rent achievability than the comps imply.
- What's the recent tenant-quality profile in this submarket — average credit score on applications, eviction rate, late-payment / NSF rate, and stable-employment percentage? A property-management company in the area should have these aggregated.
- How much new apartment / multifamily construction is in the pipeline within 1–3 miles? Heavy new supply (>2% of stock underway) typically softens rents 12–24 months out; light construction supports rent growth.
Repairs flagged (vision-AI assessment)
- Minor: Exterior siding — Some signs of wear and tear on the siding.
- Minor: Interior carpet — Some wear visible on the carpet.
CashFlowRE · CFR-9Z8GYK0PEKA694
· Data 2 days ago
cashflowre.app · 2026-05-29