 Multi-family
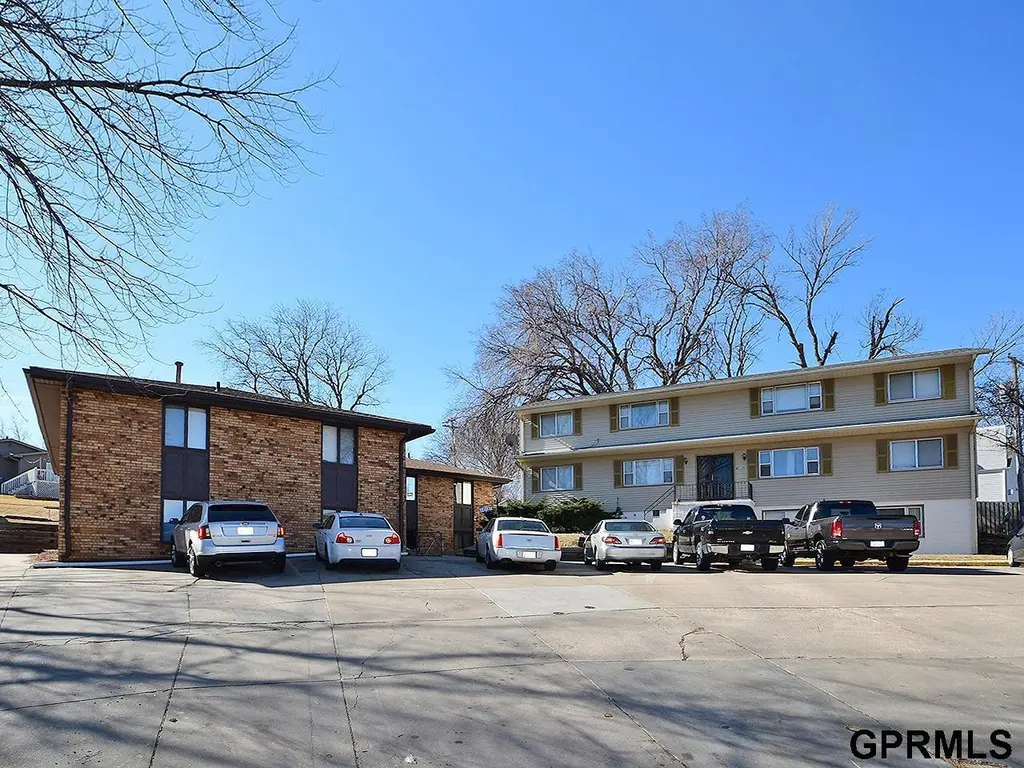
12135 Lisa Cir · Omaha, NE
Flood risk 1/10 · Minimal
- FEMA flood zone
- X (unshaded)
- Chance of flooding over 30 yrs
- 0.0%
- Est. flood insurance / yr
- $473 – $860
Fire risk 1/10 · Minimal
- Est. fire insurance / yr
- $1,161 – $2,155
Heat risk 3/10 · Minor
- Hot days now (above 104°F)
- 7 days/yr
- Hot days in 30 yrs
- 16 days/yr
Wind risk 2/10 · Minimal
- Chance of severe wind over 30 yrs
- —
Air-quality risk 2/10 · Minimal
- Unhealthy air days now
- 1 days/yr
- Unhealthy air days in 30 yrs
- 1 days/yr
Risk factors via First Street. Map © Google.
Why this score? — see what drove the B grade
The composite is a weighted blend of 9 inputs, each scored 0–100. Each bar is that input's sub-score; the figure is the points it added to the 100-point composite (weight × sub-score).
- Cash flow +30.0/30.0
- 1% rule +10.0/10.0
- DSCR +10.0/10.0
- ARV discount +7.5/15.0
- Schools +5.3/10.0
- Livability +4.2/5.0
- Rent growth +3.4/5.0
- Condition / age +2.8/5.0
- Appreciation +0.0/10.0
$1,150,000
🖨 Deal sheet 📄 Offer letter ✓ Due diligence
Multi-family units
County records classify this as Multi-Family (5+ Unit). Listing-text estimate: 1 unit. estimate disagrees with records
5+ unit building — per-unit beds/baths from public records are typically unavailable; the breakdown below (if shown) is an estimate from the listing text.
Listing remarks MLS
Exceptional investment opportunity in the heart of Millard. This well-located multi-family property features 11 total units, ten 2-bedroom, 1-bath units and one 1-bedroom, 1-bath unit, generating nearly $11,000 per month in gross rents. The property consists of two separate buildings with ample off-street parking for tenants. 12131 is constructed with durable all-brick exterior, while 12135 features low-maintenance aluminum siding. Strong rental history, desirable unit mix, and a prime location make this a solid addition to any investment portfolio.
Key facts
- Off-street parking
- Aluminum siding
- All-brick exterior
Tags
Neighborhood map
What this means for you Summary
Snapshot
- This is a multifamily listed at $1.15M. Condition is rated average.
Deal economics
- At list price, monthly cash flow is $6k ($68k/yr) — positive.
- The deal already cash-flows at list — no discount required.
- Meets the 1% rule at list price ($17k rent vs $1.15M).
- Recommended offer: $1.05M (9.0% below list) — sets the bar for market timing.
- Cap rate 12.2% vs local median 3.6% in Omaha — top-decile yield for the area; either an underpriced asset or a hidden risk that comps aren't pricing in. Stress-test before assuming the spread holds.
Location & tenants
- Location reads 84/100 on livability (#7 in NE, #663 nationally) — a professional / high-income tenant draw. Strengths: amenities A+, commute A+, cost of living A+; Watch: crime F.
- Millard Public Schools (urban): math 58% / reading 60% proficiency, ranked #13 of 111 in NE (top 12%) — acceptable for families but not a draw, mixed tenant base, ~2y average lease; only 13% free/reduced lunch — higher-income household profile.
- Market conditions: Rents rising (+3.6%/yr); 113 active listings in the ZIP; 15 comparable units currently listed for rent nearby; rentals leasing fast (median 3d on market — plan ~1-2 weeks tenant-placement turnaround); solid renter incomes; 4,539 units permitted in Douglas County in 2024 (2,583 in 5+ unit buildings).
- At $17,280/mo this rent would consume 257% of the median local household income ($81k/yr) (locally 728% of renters already pay >50% of income on rent) — very limited rent-growth headroom before tenants either downsize or default.
Forward outlook
- Local home prices are declining (-3.0%/yr); year-one equity from $8k of loan paydown is wiped out by about $34k of value loss. Plan a longer hold.
- Douglas County population projected at +28% by 2050 — long-run rental-demand tailwind backs the buy-and-hold thesis.
- At projected returns (-3.0% appreciation + 3.6% rent growth), your $322k cash investment doubles in ~6 years — after that, you're playing with house money.
Negotiation context
- It's been on market 119 days — a 9% lower offer ($1.05M) is reasonable based on typical stale-listing flexibility.
Questions for the listing agent
- It's been on market 119 days. Have you received any prior offers? Is the seller open to a 9% concession, seller financing, or rate buy-down credit?
- Built in 1963 — when were the roof, HVAC, electrical panel, plumbing, and water heater last replaced?
- Why hasn't it sold? Are there any deal-killer items the seller is aware of (foundation, flood, title, zoning, code violations)?
- Is there a deadline driving the sale (1031 exchange, divorce, estate, relocation)? That informs how much negotiation room exists.
- Crime grade is F in this area — have there been break-ins, vandalism, or insurance claims at this property in the last 3 years? What carrier currently insures it and at what premium?
- What's the average days-on-market for RENTAL listings here right now (not sales)? A rising rental-DOM trend means longer vacancies and softer asking-rent achievability than the comps imply.
- What's the recent tenant-quality profile in this submarket — average credit score on applications, eviction rate, late-payment / NSF rate, and stable-employment percentage? A property-management company in the area should have these aggregated.
- How much new apartment / multifamily construction is in the pipeline within 1–3 miles? Heavy new supply (>2% of stock underway) typically softens rents 12–24 months out; light construction supports rent growth.
Investment metrics
- 1% rule
- 1.50% ✓
- Cap rate
- 12.24%
- Cash-on-cash
- 21.26%
- DSCR
- 1.95
- GRM
- 5.5
CMA / ARV
- ARV (median comp)
- $364,926
- List price
- $1,150,000
- Delta
- 215.13%
- Verdict
- OVERPRICED
- Comps
- 2 within 1.0 mi
Show comp detail 2 sales within ~0.75 mi
| Address | Dist | Beds/Ba | Sqft | Sold | Price | $/sf | Match |
|---|---|---|---|---|---|---|---|
| 12131 & 12135 Lisa Cir | 0.01mi | —/— | — | 15mo | $950,000 | — | 75 |
| 12455 Weir St | 0.43mi | 4/2.0 | 1,560 | 18mo | $356,100 | $228 | 52 |
Match score weights: distance 35% · size 25% · config 20% · recency 20%. Top-matched comps best support the ARV.
Projected returns pro-forma
-3.0% appreciation · 3.58% rent growth · sell at horizon
- IRR
- 14.4%
- Equity multiple
- 1.58×
- Total profit
- $187,332
- Equity at exit
- $171,469
- IRR
- 23.6%
- Equity multiple
- 3.09×
- Total profit
- $674,075
- Equity at exit
- $99,431
Cash invested: $322,000 (down + closing). Projections, not guarantees.
Landlord ↔ Tenant lean methodology
- Overall (STATE)
- 83 Strongly Landlord-Friendly
- State Nebraska
- 83 Strongly Landlord-Friendly · R+13
- County
- — inherits STATE
- City
- — inherits STATE
ZIP-level market 68137
- Rents YoY
- 3.6%
- Active inventory
- 113
- Price-to-rent
- 60.0×
Monthly cashflow live
- Estimated rent
- $17,280 high interval (Pro) →
- Mortgage (P&I)
- −$6,031
- Tax est. 1.5%
- −$1,438 /mo · $17,250/yr
- Insurance
- −$479
- HOA
- −$0
- Vacancy / Maint / Mgmt
- −$3,629
- Net cashflow
- $5,704
Break-even live
11-unit breakdown (identical units grouped — click to expand)
| Units | Beds | Baths | Est. rent |
|---|---|---|---|
| 10× units | 2 | 1 | $15,980 |
| #1 | 2 | 1 | $1,598 |
| #2 | 2 | 1 | $1,598 |
| #3 | 2 | 1 | $1,598 |
| #4 | 2 | 1 | $1,598 |
| #5 | 2 | 1 | $1,598 |
| #6 | 2 | 1 | $1,598 |
| #7 | 2 | 1 | $1,598 |
| #8 | 2 | 1 | $1,598 |
| #9 | 2 | 1 | $1,598 |
| #10 | 2 | 1 | $1,598 |
| 1× unit | 1 | 1 | $1,298 |
| Total (11 units) | $17,280 | ||
UW: 25.0% down · 7.5% · 30yr · 1.5% tax · 5.0% vac · 8.0% maint · 8.0% mgmt
Financing live
Cash to close
- Down payment
- $287,500
- Closing costs
- $34,500
- Reserves months
- —
- Total cash needed
- —
Loan-product check · same deal, 3 products live
Conventional
25% down · 7.5% · 30yr
- Down + closing
- —
- Monthly P&I
- —
- Monthly cashflow
- —
- DSCR
- —
- Eligible?
- —
Personal DTI + credit; lowest rate.
DSCR
20% down · 8.5% · 30yr
- Down + closing
- —
- Monthly P&I
- —
- Monthly cashflow
- —
- DSCR
- —
- Eligible?
- —
No personal income docs; deal must DSCR.
Hard money
10% down · 12.0% · 12mo
- Down + closing
- —
- Monthly P&I
- —
- Monthly cashflow
- —
- DSCR
- —
- Eligible?
- —
Short-term bridge; refi at stabilization.
Rent comps 15 comps
| Address | Beds | Baths | Sqft | Rent | $/sqft | DOM | Units | Dist |
|---|---|---|---|---|---|---|---|---|
| 12230 Anne St Omaha, NE | 1.0–2.0 | 1.0–1.5 | 900 | $1,010 | $1.12 | 3d | 5 | 0.14mi |
| 12741 Woodcrest Dr Unit 12841 Condo Omaha, NE | 2.0 | 2.0 | 1019 | $2,200 | $2.16 | 3d | 1 | 0.57mi |
| 12727 Woodcrest Plz #123 Omaha, NE | 3.0 | 2.0 | 1508 | $2,200 | $1.46 | 43d | 1 | 0.66mi |
| 12741 Woodcrest Plz #317 Omaha, NE | 2.0 | 2.0 | 1019 | $2,400 | $2.36 | 43d | 1 | 0.69mi |
| 12775 Woodcrest Plz Omaha, NE | 1.0 | 1.0 | 750 | $975 | $1.30 | 14d | 1 | 0.72mi |
| 11025 M St Omaha, NE | 2.0 | 1.0–2.0 | 854 | $1,640 | $1.92 | 2d | 20 | 0.90mi |
| 3618 S 120th St Omaha, NE | 3.0 | 2.0 | 1524 | $2,050 | $1.35 | 2d | 1 | 0.92mi |
| 11029 R Plz Omaha, NE | 1.0–2.0 | 1.0–1.5 | 920 | $1,190 | $1.29 | 3d | 15 | 0.92mi |
| 3630 S 128th Ave Omaha, NE | 3.0 | 2.0 | 1562 | $2,100 | $1.34 | 43d | 1 | 1.08mi |
| 3605 S 112th St Omaha, NE | 3.0 | 3.0 | 1903 | $2,400 | $1.26 | 19d | 1 | 1.10mi |
| 13106 C Plz Omaha, NE | 2.0–4.0 | 1.0–2.0 | 1043 | $1,289 | $1.24 | 2d | 5 | 1.18mi |
| 5622 S 110th Cir Omaha, NE | 2.0 | 1.0 | 1600 | $1,795 | $1.12 | 43d | 1 | 1.20mi |
| 3422 S 129th St Omaha, NE | 3.0 | 2.5 | 1651 | $2,275 | $1.38 | 2d | 1 | 1.22mi |
| 5716 S 136th St Omaha, NE | 3.0 | 2.5 | 1949 | $2,200 | $1.13 | 3d | 1 | 1.35mi |
| 5091 Marshall Dr Omaha, NE | 1.0 | 1.0 | 600 | $859 | $1.43 | 3d | 5 | 1.47mi |
Listing history 16 events
-
2026-06-18days on market $1,150,000 Active 119 DOM
-
2026-06-17days on market $1,150,000 Active 118 DOM
-
2026-06-16days on market $1,150,000 Active 117 DOM
-
2026-06-15days on market $1,150,000 Active 116 DOM
-
2026-06-13days on market $1,150,000 Active 114 DOM
-
2026-06-10days on market $1,150,000 Active 111 DOM
-
2026-06-09days on market $1,150,000 Active 110 DOM
-
2026-06-08days on market $1,150,000 Active 109 DOM
-
2026-06-07pricedays on market $1,150,000 Active 108 DOM
-
2026-06-05days on market $1,210,000 Active 105 DOM
-
2026-06-03days on market $1,210,000 Active 104 DOM
-
2026-06-03days on market $1,210,000 Active 103 DOM
-
2026-06-01days on market $1,210,000 Active 102 DOM
-
2026-05-31days on market $1,210,000 Active 101 DOM
-
2026-04-28price $1,210,000 555-char remark
Show marketing remark (555 chars)
Exceptional investment opportunity in the heart of Millard. This well-located multi-family property features 11 total units, ten 2-bedroom, 1-bath units and one 1-bedroom, 1-bath unit, generating nearly $11,000 per month in gross rents. The property consists of two separate buildings with ample off-street parking for tenants. 12131 is constructed with durable all-brick exterior, while 12135 features low-maintenance aluminum siding. Strong rental history, desirable unit mix, and a prime location make this a solid addition to any investment portfolio.
-
2026-02-19$1,250,000 New 555-char remark
Show marketing remark (555 chars)
Exceptional investment opportunity in the heart of Millard. This well-located multi-family property features 11 total units, ten 2-bedroom, 1-bath units and one 1-bedroom, 1-bath unit, generating nearly $11,000 per month in gross rents. The property consists of two separate buildings with ample off-street parking for tenants. 12131 is constructed with durable all-brick exterior, while 12135 features low-maintenance aluminum siding. Strong rental history, desirable unit mix, and a prime location make this a solid addition to any investment portfolio.
ⓘ Source: listings_history table (triggers on properties + properties_extension) + one-shot
backfill from property_details.listing_events for pre-trigger history.
Climate risk First Street
- Flood 1/10 Low FEMA zone X (unshaded) · 0% chance over 30 yrs
- Wildfire 1/10 Low
- Heat 3/10 Moderate 7 d/yr ≥104°F today · 16 d/yr by 30 yrs out
- Wind 2/10 Low
- Air quality 2/10 Low 1 unhealthy d/yr today · 1 by 30 yrs out
Nearby sold comps map
Loading sold comps map…
Walkable amenities ~0.75 mi
Loading nearby amenities…
Taxation est. · year 1
- Rental income
- $207,360
- − Mortgage interest
- −$64,418
- − Property taxes
- −$17,250
- − Insurance
- −$5,750
- − Repairs & maintenance
- −$16,589
- − Management
- −$16,589
- − Depreciation
- −$33,455
- Taxable income
- $53,310
- Est. tax owed @ 24.0%
- −$12,794
- After-tax cash flow
- $55,651/yr
For passive investors: Depreciation is non-cash, so a rental often shows a tax loss while cash-flowing — sheltering income. Rental losses are passive: they offset passive income freely, and up to $25,000/yr can offset ordinary (W-2) income if you actively participate and your MAGI is under $100k (phasing out to $0 by $150k); unused losses carry forward. On sale, claimed depreciation is recaptured at up to 25%, and gains may owe capital-gains tax (a 1031 exchange can defer both). Figures are a year-1 estimate at your 24.0% rate — not tax advice; consult a CPA.
Condition & rehab AI · 13 photos
This multi-family property has average condition with some minor repairs and maintenance needed. Painting and landscaping improvements can significantly increase its value.
Repairs flagged
- Minor Exterior siding — Some signs of wear and tear on the siding.
- Minor Interior carpet — Some wear visible on the carpet.
Value-add opportunities
- Both Painting the exterior and interior — Fresh paint can improve the curb appeal and interior aesthetics, attracting more tenants and buyers.
- Both Landscaping improvements — A well-maintained landscape can enhance the property's curb appeal and attract more tenants and buyers.
Renovation cost estimate screening
| Repair item | Severity | Est. cost |
|---|---|---|
| Exterior siding · Some signs of wear and tear on the siding. | Minor | $500–3,000 |
| Interior carpet · Some wear visible on the carpet. | Minor | $500–3,000 |
| Total estimated repair cost · 2 items | $1,000–6,000 |
Value-add ROI direction
- Both Painting the exterior and interior — Fresh paint can improve the curb appeal and interior aesthetics, attracting more tenants and buyers. ↑
- Both Landscaping improvements — A well-maintained landscape can enhance the property's curb appeal and attract more tenants and buyers. ↑
ⓘ Cost ranges are severity-bucket heuristics (US national rule-of-thumb). Get contractor quotes + a written scope before underwriting a rehab budget.
Schools (NCES district)
- District
- Millard Public Schools
- NCES district ID
- 3173740
- Math proficiency
- 58% ▼ -7.00%
- Reading proficiency
- 60% ▼ -6.00%
- Median HH income
- $81,146
- Composite
- 53.23/100
- National rank
- #1500
- State rank
- #13 of 111 in NE
Livability — Omaha
- Score
- 84/100
- State rank
- #7
- US rank
- #663
Category grades
Schools grade is shown separately in the Schools card above.
Census & demographics
- Census place
- Omaha, NE
- County
- Douglas County · 538,646 people
- City population
- 552,986
- Metro
- Omaha-Council Bluffs, NE-IA
- Population (ZIP)
- 24,277
- Household income
- $80,739
- Rent vs Own
- Severe rent burden
- 728.0
Population outlook (Douglas County) Hauer SSP2
- Today (2025)
- 625,245 people
- By 2030
- 661,613 · +5.8%
- By 2040
- 732,395 · +17.1%
- By 2050
- 801,988 · +28.3%
- By 2075
- 968,637 · +54.9%
- By 2100
- 1,101,871 · +76.2%
Race, ethnicity, and origin ACS 2023
- Neighborhood character
- Predominantly White (79%)
- Race & ethnicity
- White 79% Hispanic / Latino 9% Two or more races 7% Asian 5% Black 2%
- Hispanic origin (detail)
- Mexican 6%
- Common ancestry
- Romanian 4% Lithuanian 2% Portuguese 2%
- Foreign-born
- 9% · Canada, Vietnam, South Korea
- Languages at home
- 90% English-only · Spanish 5% Other Asian/Pacific 2% Other Indo-European 1%
Political lean MEDSL · Douglas
- 2024 margin
- D (+10.2) · D 54.4% · R 44.2% · Other 1.4%
- 2008→2024 swing
- +5.5pp toward D · 2008: 4.6pp · 2024: 10.2pp
- All cycles
- 2024: D+10.2 2020: D+11.3 2016: D+1.4 2012: R+4.3 2008: D+4.6
Not yet ingested
- Civics
- —
Market trends
- HPI YoY
- ▼ -240.79%
- Current HPI
- 231.568
- Rent YoY
- ▲ 3.58%
- Metro
- Omaha-Council Bluffs, NE-IA
- State GDP YoY
- ▲ 0.68%
- F500 in state
- 2
Industry mix (Fortune 500 HQ in NE)
| Industry | F500 HQs | Revenue |
|---|---|---|
| Conglomerate | 1 | $371B |
|
||
Price history
-3.2% since first listed2 events — show timeline
- 2026-04-28 Price Changed $1,210,000 GPRMLS
- 2026-02-19 Listed $1,250,000 GPRMLS
Cash-flow waterfall
monthlySold comps — $/sqft
last 12 mo · ≤1 miLoading sold comps…