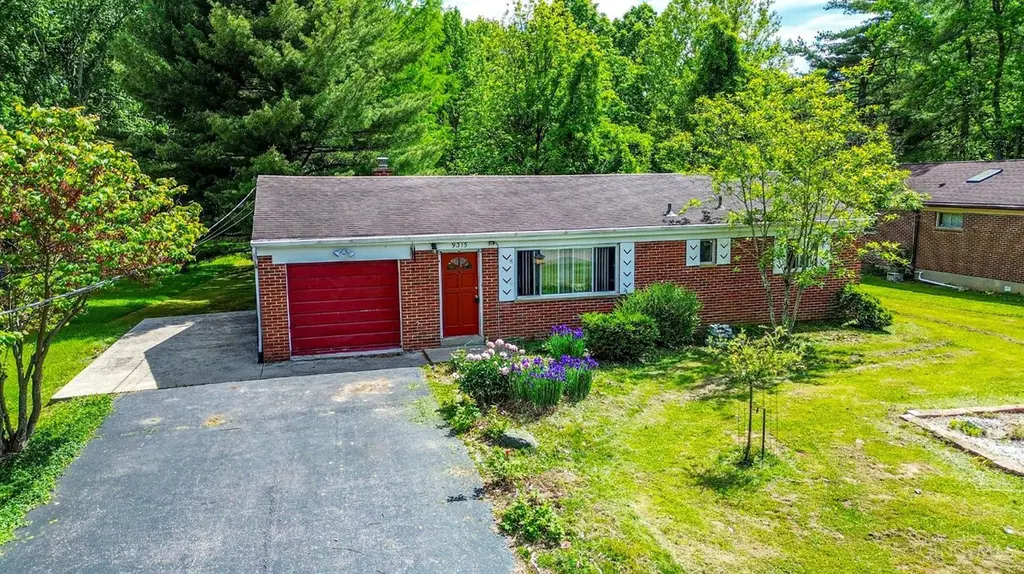
9315 Greenhedge Ln
Loveland, OH 45140
$289,900D
3 bd · 1.0 ba ·
1,063 sqft ·
Built 1956
· SingleFamily
· Active
· 41 DOM
Cashflow @ list (25.0% down · 7.5%)
Estimated rent
$2,221/mo
Mortgage (P&I)
−$1,520
Tax + insurance
−$400
HOA
−$0
Vac / Maint / Mgmt
−$466
Net cashflow
$-166/mo
Annual
$-1,987/yr
Cap rate
5.61%
Cash-on-cash
-2.45%
DSCR
0.89
1% rule
0.77%
Cash to close
$81,172
Investor read
- This is a 3-bed/1.0-bath single-family listed at $290k.
- At list price, monthly cash flow is $-166 ($-2k/yr) — negative.
- To cash-flow at today's rent, offer at most $261k (10.1% below list).
- To meet the 1% rule (rent ≥ 1% of price), the offer needs to be $222k (23.4% below list).
- It's been on market 41 days — a 3% lower offer ($281k) is reasonable based on typical stale-listing flexibility.
- Recommended offer: $222k (23.4% below list) — sets the bar for 1% rule.
- Local home prices are declining (-3.0%/yr); year-one equity from $2k of loan paydown is wiped out by about $9k of value loss. Plan a longer hold.
- Location reads 84/100 on livability (#49 in OH, #696 nationally) — a professional / high-income tenant draw. Strengths: crime A+, amenities A+, cost of living A+; Watch: commute F.
- Loveland City (suburban): math 76% / reading 78% proficiency, ranked #50 of 656 in OH (top 8%) — strong family-tenant draw, lease renewals of 3-5y typical; only 12% free/reduced lunch — higher-income household profile.
- Zoned schools: Loveland Elementary School (math 85% / reading 76%, grade A+, #159 of 1,584 statewide, top 10%, 640 students, 15% FRL); Loveland Middle School (math 74% / reading 76%, grade A, #83 of 654 statewide, top 13%, 650 students, 12% FRL); Loveland High School (math 66% / reading 86%, grade A-, #63 of 781 statewide, top 8%, 1,309 students, 9% FRL) — zoned schools at 12% FRL track the district average.
- Watch-outs: built in 1956 — expect roof / HVAC / electrical / plumbing capex.
- Market conditions: Rents rising fast (+4.4%/yr); 156 active listings in the ZIP; 9 comparable units currently listed for rent nearby; rentals leasing fast (median 4d on market — plan ~1-2 weeks tenant-placement turnaround); high-income renter base; 801 units permitted in Hamilton County in 2024 (190 in 5+ unit buildings).
- 2 sale attempts since 6y ago with the ask held roughly flat each time — persistent listings suggest the price (not the market) is what's stuck; bring a comps-based counter.
- Current owner paid $174k; list at $290k implies a 67% gain — meaningful room to come down on a strong offer.
- Cap rate 5.6% vs local median 3.0% in Loveland — top-decile yield for the area; either an underpriced asset or a hidden risk that comps aren't pricing in. Stress-test before assuming the spread holds.
Questions for listing agent
- What do current leases actually rent for vs. the listed asking? Can we see a recent rent roll and the last 12 months of T-12 income?
- It's been on market 41 days. Have you received any prior offers? Is the seller open to a 23% concession, seller financing, or rate buy-down credit?
- Built in 1956 — when were the roof, HVAC, electrical panel, plumbing, and water heater last replaced?
- Is there a deadline driving the sale (1031 exchange, divorce, estate, relocation)? That informs how much negotiation room exists.
- Schools are A-rated — typically a magnet for longer-tenancy family renters. What's the average tenant stay here, and is there a school-zone premium baked into asking?
- The area grade is low — what's the realistic commute time and amenity access for the typical tenant pool here? Any planned neighborhood developments (good or bad) we should know about?
- What's the average days-on-market for RENTAL listings here right now (not sales)? A rising rental-DOM trend means longer vacancies and softer asking-rent achievability than the comps imply.
- What's the recent tenant-quality profile in this submarket — average credit score on applications, eviction rate, late-payment / NSF rate, and stable-employment percentage? A property-management company in the area should have these aggregated.
CashFlowRE · CFR-9ZFBQ3DC7KC6RX
· Data 1 day ago
cashflowre.app · 2026-05-29