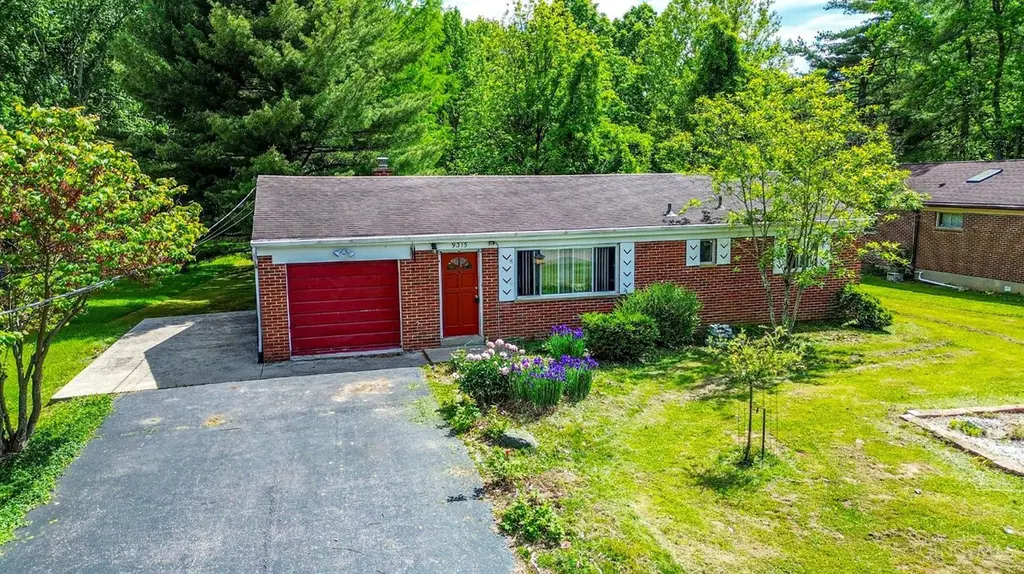
9315 Greenhedge Ln · Loveland, OH
Flood risk 1/10 · Minimal
- FEMA flood zone
- X (unshaded)
- Chance of flooding over 30 yrs
- 0.0%
- Est. flood insurance / yr
- $473 – $860
Fire risk 1/10 · Minimal
- Est. fire insurance / yr
- $713 – $1,323
Heat risk 4/10 · Minor
- Hot days now (above 101°F)
- 7 days/yr
- Hot days in 30 yrs
- 19 days/yr
Wind risk 2/10 · Minimal
- Chance of severe wind over 30 yrs
- 1.0%
Air-quality risk 4/10 · Minor
- Unhealthy air days now
- 5 days/yr
- Unhealthy air days in 30 yrs
- 7 days/yr
Risk factors via First Street. Map © Google.
Why this score? — see what drove the D grade
The composite is a weighted blend of 9 inputs, each scored 0–100. Each bar is that input's sub-score; the figure is the points it added to the 100-point composite (weight × sub-score).
- Cash flow +10.2/30.0
- ARV discount +9.8/15.0
- Schools +6.9/10.0
- Livability +4.2/5.0
- Rent growth +3.6/5.0
- DSCR +2.9/10.0
- 1% rule +2.7/10.0
- Condition / age +2.5/5.0
- Appreciation +0.0/10.0
$289,900
🖨 Deal sheet (PDF) 📄 Offer letter ✓ Due diligence
Listing remarks MLS
Home has been well loved and maintained by same owners for 60yrs. Roof is only a few years old, Solid Brick Ranch home, hardwood floors. On a beautiful Cul-de-sac st, perfect location, 5 mins to shopping and schools. Amazing wooded backyard, perfect for a fire pit, pool, play-sets! Full basement, Seller is offering a Home Warranty.
Key facts
- 0.61 acre lot
- Garage
- Built 1956
Property features AI
Finance
- Other: Lot topography is level; Lot is approximately .5 to .9 acres
- HOA & community: No HOA
Exterior
- Parking: Attached oversized front garage (1 car); Driveway parking; On-street parking
- Utilities: Public water; Public sewer
- Home design: Ranch style single-family home; One level; Residential zoning; Level, partially wooded lot of about 0.61 acres
- Construction: Brick construction; Block foundation; Shingle roof; Built as a single-family residence
- Exterior features: Fire pit; Patio; Vinyl windows
Interior
- Kitchen: Wood cabinets
- Bedrooms: Three bedrooms on the main level; Primary bedroom approximately 14 x 11; Second bedroom approximately 11 x 11; Third bedroom approximately 11 x 9
- Flooring: Wood floors in living area
- Bathrooms: Two full bathrooms (one on main level, one on lower level)
- Heating & cooling: Forced air heating; Oil heating; Central air conditioning; Electric water heater
- Interior features: Walkout living room; Wood floors; Partially finished basement with concrete floor and glass block windows; Full basement; Seven total rooms
- Laundry & utility: Lower-level laundry room (about 8 x 8); Washer and dryer included; Sump pump
Neighborhood map
What this means for you Summary
Snapshot
- This is a 3-bed/1.0-bath single-family listed at $290k.
Deal economics
- At list price, monthly cash flow is $-166 ($-2k/yr) — negative.
- To cash-flow at today's rent, offer at most $261k (10.1% below list).
- To meet the 1% rule (rent ≥ 1% of price), the offer needs to be $222k (23.4% below list).
- Recommended offer: $222k (23.4% below list) — sets the bar for 1% rule.
- Cap rate 5.6% vs local median 3.0% in Loveland — top-decile yield for the area; either an underpriced asset or a hidden risk that comps aren't pricing in. Stress-test before assuming the spread holds.
Location & tenants
- Location reads 84/100 on livability (#49 in OH, #696 nationally) — a professional / high-income tenant draw. Strengths: crime A+, amenities A+, cost of living A+; Watch: commute F.
- Loveland City (suburban): math 76% / reading 78% proficiency, ranked #50 of 656 in OH (top 8%) — strong family-tenant draw, lease renewals of 3-5y typical; only 12% free/reduced lunch — higher-income household profile.
- Zoned schools: Loveland Elementary School (math 85% / reading 76%, grade A+, #159 of 1,584 statewide, top 10%, 640 students, 15% FRL); Loveland Middle School (math 74% / reading 76%, grade A, #83 of 654 statewide, top 13%, 650 students, 12% FRL); Loveland High School (math 66% / reading 86%, grade A-, #63 of 781 statewide, top 8%, 1,309 students, 9% FRL) — zoned schools at 12% FRL track the district average.
- Market conditions: Rents rising fast (+4.4%/yr); 156 active listings in the ZIP; 9 comparable units currently listed for rent nearby; rentals leasing fast (median 4d on market — plan ~1-2 weeks tenant-placement turnaround); high-income renter base; 801 units permitted in Hamilton County in 2024 (190 in 5+ unit buildings).
Forward outlook
- Local home prices are declining (-3.0%/yr); year-one equity from $2k of loan paydown is wiped out by about $9k of value loss. Plan a longer hold.
Negotiation context
- It's been on market 41 days — a 3% lower offer ($281k) is reasonable based on typical stale-listing flexibility.
- 2 sale attempts since 6y ago with the ask held roughly flat each time — persistent listings suggest the price (not the market) is what's stuck; bring a comps-based counter.
- Current owner paid $174k; list at $290k implies a 67% gain — meaningful room to come down on a strong offer.
Risks & watch-outs
- Watch-outs: built in 1956 — expect roof / HVAC / electrical / plumbing capex.
Questions for the listing agent
- What do current leases actually rent for vs. the listed asking? Can we see a recent rent roll and the last 12 months of T-12 income?
- It's been on market 41 days. Have you received any prior offers? Is the seller open to a 23% concession, seller financing, or rate buy-down credit?
- Built in 1956 — when were the roof, HVAC, electrical panel, plumbing, and water heater last replaced?
- Is there a deadline driving the sale (1031 exchange, divorce, estate, relocation)? That informs how much negotiation room exists.
- Schools are A-rated — typically a magnet for longer-tenancy family renters. What's the average tenant stay here, and is there a school-zone premium baked into asking?
- The area grade is low — what's the realistic commute time and amenity access for the typical tenant pool here? Any planned neighborhood developments (good or bad) we should know about?
- What's the average days-on-market for RENTAL listings here right now (not sales)? A rising rental-DOM trend means longer vacancies and softer asking-rent achievability than the comps imply.
- What's the recent tenant-quality profile in this submarket — average credit score on applications, eviction rate, late-payment / NSF rate, and stable-employment percentage? A property-management company in the area should have these aggregated.
- How much new for-sale + rental construction is in the pipeline within 1–3 miles? Heavy new supply typically softens prices + rents 12–24 months out; constrained supply supports both.
Investment metrics
- 1% rule
- 0.77% ✗
- Cap rate
- 5.61%
- Cash-on-cash
- -2.45%
- DSCR
- 0.89
- GRM
- 10.9
CMA / ARV
- ARV (median comp)
- $305,733
- List price
- $289,900
- Delta
- -5.18%
- Verdict
- FAIR
- Comps
- 20 within 1.0 mi
Show comp detail 3 sales within ~0.75 mi
| Address | Dist | Beds/Ba | Sqft | Sold | Price | $/sf | Match |
|---|---|---|---|---|---|---|---|
| 9330 Greenhedge Ln | 0.05mi | 3/1.0 | 975 (-8%) | 7mo | $310,000 | $318 | 78 |
| 9375 Greenhedge Ln | 0.12mi | 3/2.0 | 988 (-7%) | 19mo | $322,500 | $326 | 63 |
| 9580 Creekside Dr | 0.73mi | 3/2.0 | 1,217 (+14%) | 13mo | $215,000 | $177 | 27 |
Match score weights: distance 35% · size 25% · config 20% · recency 20%. Top-matched comps best support the ARV.
Projected returns pro-forma
-3.0% appreciation · 4.36% rent growth · sell at horizon
- IRR
- -18.9%
- Equity multiple
- 0.33×
- Total profit
- $-54,457
- Equity at exit
- $43,225
- IRR
- -9.1%
- Equity multiple
- 0.41×
- Total profit
- $-48,072
- Equity at exit
- $25,065
Cash invested: $81,172 (down + closing). Projections, not guarantees.
Landlord ↔ Tenant lean methodology
- Overall (STATE)
- 73 Landlord-Friendly
- State Ohio
- 73 Landlord-Friendly · R+6
- County
- — inherits STATE
- City
- — inherits STATE
ZIP-level market 45140
- Rents YoY
- 4.4%
- Active inventory
- 156
- Price-to-rent
- 10.9×
Monthly cashflow live
- Estimated rent
- $2,221 high interval (Pro) →
- Mortgage (P&I)
- −$1,520
- Tax from tax record
- −$279 /mo · $3,352/yr
- Insurance
- −$121
- HOA
- −$0
- Vacancy / Maint / Mgmt
- −$466
- Net cashflow
- $-166
Break-even live
Sensitivity live
| Price | -10% $-1 | -5% $-84 | +0% $-166 | +5% $-248 | +10% $-330 |
|---|---|---|---|---|---|
| Rent | -10% $-341 | -5% $-253 | +0% $-166 | +5% $-78 | +10% $10 |
| Rate | -1.0pp $-20 | -0.5pp $-92 | base $-166 | +0.5pp $-241 | +1.0pp $-317 |
UW: 25.0% down · 7.5% · 30yr · 1.5% tax · 5.0% vac · 8.0% maint · 8.0% mgmt
Financing live
Cash to close
- Down payment
- $72,475
- Closing costs
- $8,697
- Reserves months
- —
- Total cash needed
- —
Loan-product check · same deal, 3 products live
Conventional
25% down · 7.5% · 30yr
- Down + closing
- —
- Monthly P&I
- —
- Monthly cashflow
- —
- DSCR
- —
- Eligible?
- —
Personal DTI + credit; lowest rate.
DSCR
20% down · 8.5% · 30yr
- Down + closing
- —
- Monthly P&I
- —
- Monthly cashflow
- —
- DSCR
- —
- Eligible?
- —
No personal income docs; deal must DSCR.
Hard money
10% down · 12.0% · 12mo
- Down + closing
- —
- Monthly P&I
- —
- Monthly cashflow
- —
- DSCR
- —
- Eligible?
- —
Short-term bridge; refi at stabilization.
Rent comps 9 comps
| Address | Beds | Baths | Sqft | Rent | $/sqft | DOM | Units | Dist |
|---|---|---|---|---|---|---|---|---|
| 3029 Stratford Ct Loveland, OH | 3.0 | 2.0 | 1315 | $2,250 | $1.71 | 19d | 1 | 0.24mi |
| 3030 Stratford Ct Loveland, OH | 2.0 | 2.5 | 1500 | $2,100 | $1.40 | 16d | 1 | 0.31mi |
| 2071 Stratford Ct Loveland, OH | 3.0 | 1.5 | 1120 | $1,895 | $1.69 | 45d | 1 | 0.31mi |
| 8713 Harper Point Dr Cincinnati, OH | 1.0–3.0 | 1.0–2.5 | 1050 | $2,596 | $2.47 | 3d | 19 | 0.85mi |
| 11513 Village Brook Dr Cincinnati, OH | 1.0–3.0 | 1.0–2.0 | 1088 | $2,932 | $2.69 | 3d | 34 | 1.02mi |
| 120 Carrington Ln Apt 208 Loveland, OH | 2.0 | 2.0 | 1200 | $2,095 | $1.75 | 3d | 1 | 1.09mi |
| 9169 Dominion Cir Cincinnati, OH | 2.0 | 2.5 | 1486 | $2,100 | $1.41 | 25d | 1 | 1.19mi |
| 8650 Governors Hill Dr Cincinnati, OH | 2.0 | 1.0–2.0 | 948 | $2,492 | $2.63 | 3d | 23 | 1.44mi |
| 9630 Waterford Pl Loveland, OH | 1.0–2.0 | 1.0–2.0 | 1084 | $2,105 | $1.94 | 3d | 30 | 1.44mi |
Listing history 21 events
-
2026-06-21days on market $289,900 Active 41 DOM
-
2026-06-18days on market $289,900 Active 38 DOM
-
2026-06-17days on market $289,900 Active 37 DOM
-
2026-06-16days on market $289,900 Active 36 DOM
-
2026-06-15days on market $289,900 Active 35 DOM
-
2026-06-13days on market $289,900 Active 33 DOM
-
2026-06-13days on market $289,900 Active 32 DOM
-
2026-06-09days on market $289,900 Active 29 DOM
-
2026-06-08days on market $289,900 Active 28 DOM
-
2026-06-07days on market $289,900 Active 27 DOM
-
2026-06-05days on market $289,900 Active 24 DOM
-
2026-06-03days on market $289,900 Active 23 DOM
-
2026-06-02days on market $289,900 Active 22 DOM
-
2026-06-01days on market $289,900 Active 21 DOM
-
2026-05-31days on market $289,900 Active 20 DOM
-
2026-05-12$299,000 Active 304-char remark
-
2020-10-23soldstatus $173,500
-
2020-10-07soldstatus $173,500 Sold 336-char remark
Show marketing remark (336 chars)
Home has been well loved and maintained by same owners for 60yrs. Roof is only a few years old, Solid Brick Ranch home, hardwood floors. On a beautiful Cul-de-sac st, perfect location, 5 mins to shopping and schools. Amazing wooded backyard, perfect for a fire pit, pool, play-sets! Full basement, Seller is offering a Home Warranty.
-
2020-08-18historical Contingency Pending 336-char remark
Show marketing remark (336 chars)
Home has been well loved and maintained by same owners for 60yrs. Roof is only a few years old, Solid Brick Ranch home, hardwood floors. On a beautiful Cul-de-sac st, perfect location, 5 mins to shopping and schools. Amazing wooded backyard, perfect for a fire pit, pool, play-sets! Full basement, Seller is offering a Home Warranty.
-
2020-07-25price $179,900 336-char remark
Show marketing remark (336 chars)
Home has been well loved and maintained by same owners for 60yrs. Roof is only a few years old, Solid Brick Ranch home, hardwood floors. On a beautiful Cul-de-sac st, perfect location, 5 mins to shopping and schools. Amazing wooded backyard, perfect for a fire pit, pool, play-sets! Full basement, Seller is offering a Home Warranty.
-
2020-07-10$185,500 Active 336-char remark
Show marketing remark (336 chars)
Home has been well loved and maintained by same owners for 60yrs. Roof is only a few years old, Solid Brick Ranch home, hardwood floors. On a beautiful Cul-de-sac st, perfect location, 5 mins to shopping and schools. Amazing wooded backyard, perfect for a fire pit, pool, play-sets! Full basement, Seller is offering a Home Warranty.
ⓘ Source: listings_history table (triggers on properties + properties_extension) + one-shot
backfill from property_details.listing_events for pre-trigger history.
Tax reassessment forecast OH · Partial reset (capped growth)
- Current annual tax
- $3,352 · $279/mo
- Projected year-2 tax
- $3,937 · $328/mo
- Expected delta
- +$585/yr (+$49/mo · 17.5%)
ⓘ Screening estimate from a state-policy table — verify with the county assessor before closing.
Climate risk First Street
- Flood 1/10 Low FEMA zone X (unshaded) · 0% chance over 30 yrs
- Wildfire 1/10 Low
- Heat 4/10 Moderate 7 d/yr ≥101°F today · 19 d/yr by 30 yrs out
- Wind 2/10 Low 100% chance of damaging wind over 30 yrs
- Air quality 4/10 Moderate 5 unhealthy d/yr today · 7 by 30 yrs out
Nearby sold comps map
Loading sold comps map…
Walkable amenities ~0.75 mi
Loading nearby amenities…
Taxation est. · year 1
- Rental income
- $26,656
- − Mortgage interest
- −$16,239
- − Property taxes
- −$3,352
- − Insurance
- −$1,450
- − Repairs & maintenance
- −$2,132
- − Management
- −$2,132
- − Depreciation
- −$8,433
- Taxable loss
- −$7,083
- Est. tax savings @ 24.0%
- +$1,700
- After-tax cash flow
- $-287/yr
For passive investors: Depreciation is non-cash, so a rental often shows a tax loss while cash-flowing — sheltering income. Rental losses are passive: they offset passive income freely, and up to $25,000/yr can offset ordinary (W-2) income if you actively participate and your MAGI is under $100k (phasing out to $0 by $150k); unused losses carry forward. On sale, claimed depreciation is recaptured at up to 25%, and gains may owe capital-gains tax (a 1031 exchange can defer both). Figures are a year-1 estimate at your 24.0% rate — not tax advice; consult a CPA.
Schools (NCES district)
- District
- Loveland City
- NCES district ID
- 3904427
- Math proficiency
- 76% ▼ -8.00%
- Reading proficiency
- 78% ▼ -5.00%
- Median HH income
- $93,598
- Composite
- 69.34/100
- National rank
- #314
- State rank
- #50 of 656 in OH
Livability — Loveland
- Score
- 84/100
- State rank
- #49
- US rank
- #696
Category grades
Schools grade is shown separately in the Schools card above.
Census & demographics
- County
- Clermont County · 173,169 people
- City population
- 57,211
- Metro
- Cincinnati, OH-KY-IN
- Population (ZIP)
- 57,211
- Household income
- $114,827
- Rent vs Own
- Severe rent burden
- 928.0
Population outlook (Hamilton County) Hauer SSP2
- Today (2025)
- 826,054 people
- By 2030
- 830,947 · +0.6%
- By 2040
- 832,319 · +0.8%
- By 2050
- 822,428 · -0.4%
- By 2075
- 788,688 · -4.5%
- By 2100
- 710,674 · -14.0%
Race, ethnicity, and origin ACS 2023
- Neighborhood character
- Predominantly White (87%)
- Race & ethnicity
- White 87% Two or more races 5% Hispanic / Latino 4% Asian 4% Black 2%
- Common ancestry
- Slovak 3% Romanian 3% Italian 3%
- Foreign-born
- 6% · Canada, South Korea
- Languages at home
- 92% English-only · Other Asian/Pacific 2% Spanish 2% Russian/Polish/Slavic 1%
Political lean MEDSL · Hamilton
- 2024 margin
- D (+14.9) · D 57.0% · R 42.1%
- 2008→2024 swing
- +7.9pp toward D · 2008: 7.0pp · 2024: 14.9pp
- All cycles
- 2024: D+14.9 2020: D+15.9 2016: D+9.5 2012: D+4.9 2008: D+7.0
Not yet ingested
- Civics
- —
Market trends
- HPI YoY
- ▼ -240.61%
- Current HPI
- 243.9481
- Rent YoY
- ▲ 4.36%
- Metro
- Cincinnati, OH-KY-IN
- State GDP YoY
- ▲ 1.98%
- F500 in state
- 48
Industry mix (Fortune 500 HQ in OH)
| Industry | F500 HQs | Revenue |
|---|---|---|
| Insurance | 3 | $145B |
|
||
| Industrial Machinery | 3 | $49B |
|
||
| Financial Services | 3 | $24B |
|
||
| Consumer Goods | 2 | $93B |
|
||
| Aerospace / Defense | 2 | $47B |
|
||
| Utilities | 2 | $33B |
|
||
Price history
+56.3% since first listed7 events — show timeline
- 2026-05-27 Price Changed $289,900 Cincy MLS
- 2026-05-12 Listed $299,000 Cincy MLS
- 2020-10-23 Sold (Public Records) $173,500 Public Records
- 2020-10-07 Sold (MLS) $173,500 Cincy MLS
- 2020-08-18 Contingent — Cincy MLS
- 2020-07-25 Price Changed $179,900 Cincy MLS
- 2020-07-10 Listed $185,500 Cincy MLS
Property tax history
+3.4%/yrLatest (2025): $3,352 · +3.2% YoY. Source: county tax records.
Cash-flow waterfall
monthlySold comps — $/sqft
last 12 mo · ≤1 miLoading sold comps…