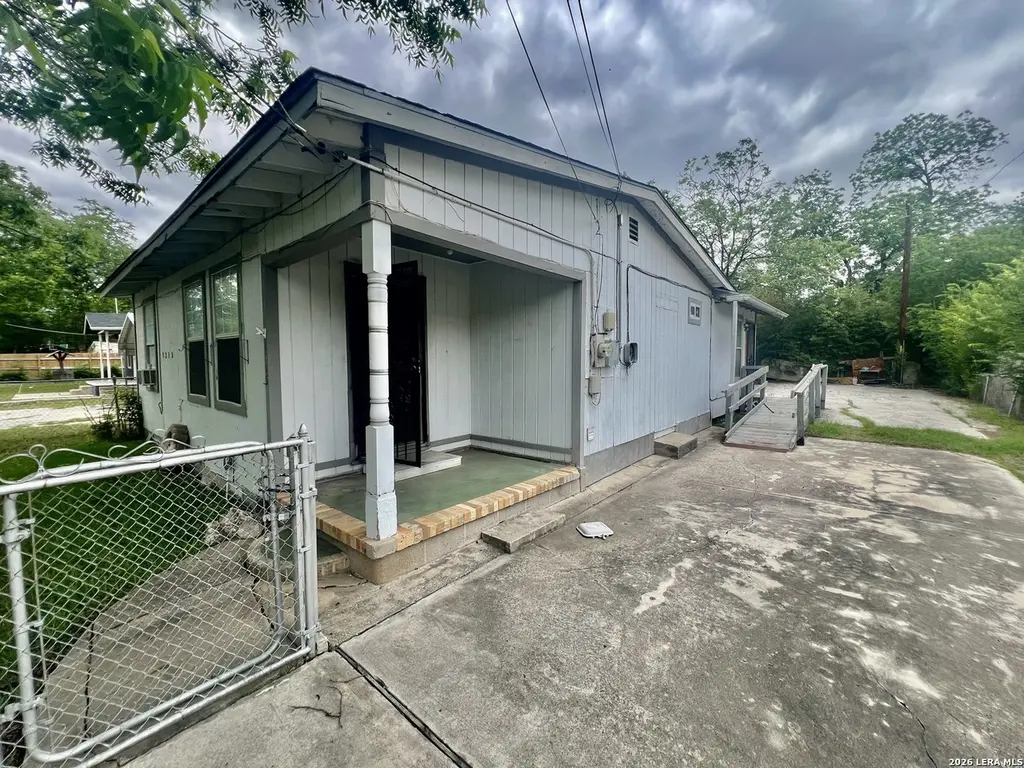
1315 Brighton
San Antonio, TX 78211
$99,500B+
3 bd · 2.0 ba ·
1,176 sqft ·
Built 1940
· SingleFamily
· Active
· 27 DOM
Cashflow @ list (25.0% down · 7.5%)
Estimated rent
$1,420/mo
Mortgage (P&I)
−$522
Tax + insurance
−$330
HOA
−$0
Vac / Maint / Mgmt
−$298
Net cashflow
$270/mo
Annual
$3,236/yr
Cap rate
9.55%
Cash-on-cash
11.62%
DSCR
1.52
1% rule
1.43%
Cash to close
$27,860
Investor read
- This is a 3-bed/2.0-bath single-family listed at $100k.
- At list price, monthly cash flow is $270 ($3k/yr) — positive.
- The deal already cash-flows at list — no discount required.
- Meets the 1% rule at list price ($1k rent vs $100k).
- It's been on market 27 days — a 2% lower offer ($98k) is reasonable based on typical stale-listing flexibility.
- Recommended offer: $98k (1.5% below list) — sets the bar for market timing.
- In year one you build about $241 of equity ($688 loan paydown + $-447 appreciation (-0.5% local appreciation)).
- Location reads 80/100 on livability (#31 in TX, #1,616 nationally) — a professional / high-income tenant draw. Strengths: amenities A+, commute A+, cost of living A+; Watch: schools C-, crime F.
- Harlandale ISD (urban): math 20% / reading 27% proficiency, ranked #748 of 826 in TX (top 91%) — low school quality limits family demand, transient renter base, plan for 1-2y turnover; 66% free/reduced lunch — lower-income household profile, screen leases tightly.
- Watch-outs: property tax is 3.5% of price; built in 1940 — expect roof / HVAC / electrical / plumbing capex.
- Market conditions: 152 active listings in the ZIP; 30 comparable units currently listed for rent nearby; rentals at typical pace (median 24d on market — plan ~3-4 weeks tenant-placement turnaround); 8,308 units permitted in Bexar County in 2024 (2,506 in 5+ unit buildings).
- Bexar County population projected at +50% by 2050 — long-run rental-demand tailwind backs the buy-and-hold thesis.
- 2 sale attempts since 2y ago; this cycle's ask has dropped $90k (47%) from the opening price — seller is motivated, your offer sets the floor, not the list.
- At projected returns (-0.5% appreciation + 3.0% rent growth), your $28k cash investment doubles in ~7 years — after that, you're playing with house money.
- Climate carrying-cost: major wind risk, 78% chance of damaging wind over 30y; extreme-heat days projected 7→22/yr by 2055 (HVAC capex compounding) — expect insurance premiums to compound above CPI over the hold.
- Cap rate 9.5% vs local median 3.8% in San Antonio — top-decile yield for the area; either an underpriced asset or a hidden risk that comps aren't pricing in. Stress-test before assuming the spread holds.
- This rent runs 31% of the median local income ($55k/yr) — at the standard rent-burdened threshold; future hikes will face affordability resistance.
Questions for listing agent
- Built in 1940 — when were the roof, HVAC, electrical panel, plumbing, and water heater last replaced?
- Property tax is high relative to price — has the assessment been appealed recently, and will the sale trigger a re-assessment?
- Is there a deadline driving the sale (1031 exchange, divorce, estate, relocation)? That informs how much negotiation room exists.
- Crime grade is F in this area — have there been break-ins, vandalism, or insurance claims at this property in the last 3 years? What carrier currently insures it and at what premium?
- What's the average days-on-market for RENTAL listings here right now (not sales)? A rising rental-DOM trend means longer vacancies and softer asking-rent achievability than the comps imply.
- What's the recent tenant-quality profile in this submarket — average credit score on applications, eviction rate, late-payment / NSF rate, and stable-employment percentage? A property-management company in the area should have these aggregated.
- How much new for-sale + rental construction is in the pipeline within 1–3 miles? Heavy new supply typically softens prices + rents 12–24 months out; constrained supply supports both.
CashFlowRE · CFR-A0WT5E8M9PJMKB
· Data 2 days ago
cashflowre.app · 2026-05-29