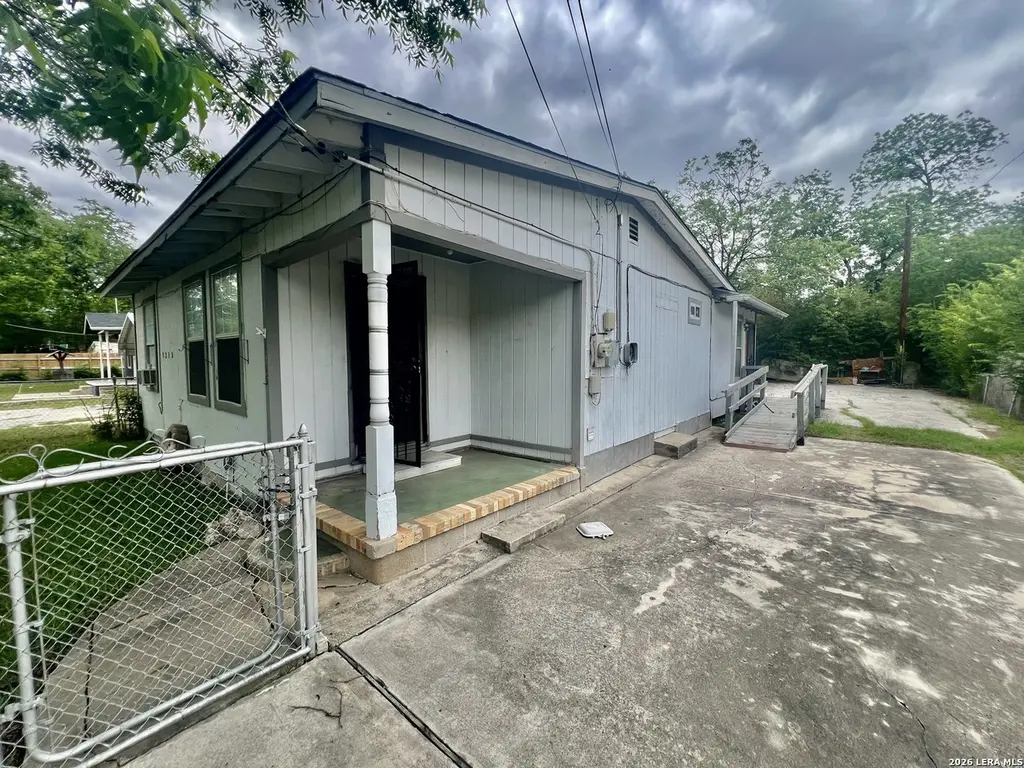
1315 Brighton · San Antonio, TX
Flood risk 3/10 · Minor
- FEMA flood zone
- X (unshaded)
- Chance of flooding over 30 yrs
- 0.2%
- Est. flood insurance / yr
- $507 – $1,088
Fire risk 1/10 · Minimal
- Est. fire insurance / yr
- $1,222 – $2,270
Heat risk 8/10 · Major
- Hot days now (above 108°F)
- 7 days/yr
- Hot days in 30 yrs
- 22 days/yr
Wind risk 7/10 · Major
- Chance of severe wind over 30 yrs
- 78.0%
Air-quality risk 2/10 · Minimal
- Unhealthy air days now
- 1 days/yr
- Unhealthy air days in 30 yrs
- 2 days/yr
Risk factors via First Street. Map © Google.
Why this score? — see what drove the B+ grade
The composite is a weighted blend of 9 inputs, each scored 0–100. Each bar is that input's sub-score; the figure is the points it added to the 100-point composite (weight × sub-score).
- Cash flow +26.7/30.0
- ARV discount +15.0/15.0
- 1% rule +9.3/10.0
- DSCR +9.2/10.0
- Appreciation +4.8/10.0
- Livability +4.0/5.0
- Rent growth +2.5/5.0
- Condition / age +2.5/5.0
- Schools +1.9/10.0
$99,500
🖨 Deal sheet 📄 Offer letter ✓ Due diligence
Listing remarks
Opportunity awaits at 1315 Brighton! This single-story 3-bedroom, 1-bath home offers 1,176 square feet of potential and is perfect for investors, flippers, or buyers looking to add their personal touch. Inside, you'll find spacious living and dining areas with a functional layout ready for a refresh and modernization. Located in the established Harlandale area, this property offers convenient access to IH-35, shopping, dining, and downtown San Antonio. While the home does need updates and TLC, it presents a fantastic opportunity to create value and make it your own. Whether you're searching for your next investment project or a fixer-upper with potential, this property is full of possibilit
Key facts
- Single-story
- Downtown san antonio
- Shopping
Tags
Neighborhood map
What this means for you Summary
Snapshot
- This is a 3-bed/2.0-bath single-family listed at $100k.
Deal economics
- At list price, monthly cash flow is $270 ($3k/yr) — positive.
- The deal already cash-flows at list — no discount required.
- Meets the 1% rule at list price ($1k rent vs $100k).
- Recommended offer: $98k (1.5% below list) — sets the bar for market timing.
- Cap rate 9.5% vs local median 3.8% in San Antonio — top-decile yield for the area; either an underpriced asset or a hidden risk that comps aren't pricing in. Stress-test before assuming the spread holds.
Location & tenants
- Location reads 80/100 on livability (#31 in TX, #1,616 nationally) — a professional / high-income tenant draw. Strengths: amenities A+, commute A+, cost of living A+; Watch: schools C-, crime F.
- Harlandale ISD (urban): math 20% / reading 27% proficiency, ranked #748 of 826 in TX (top 91%) — low school quality limits family demand, transient renter base, plan for 1-2y turnover; 66% free/reduced lunch — lower-income household profile, screen leases tightly.
- Market conditions: 152 active listings in the ZIP; 30 comparable units currently listed for rent nearby; rentals at typical pace (median 24d on market — plan ~3-4 weeks tenant-placement turnaround); 8,308 units permitted in Bexar County in 2024 (2,506 in 5+ unit buildings).
- This rent runs 31% of the median local income ($55k/yr) — at the standard rent-burdened threshold; future hikes will face affordability resistance.
Forward outlook
- In year one you build about $241 of equity ($688 loan paydown + $-447 appreciation (-0.5% local appreciation)).
- Bexar County population projected at +50% by 2050 — long-run rental-demand tailwind backs the buy-and-hold thesis.
- At projected returns (-0.5% appreciation + 3.0% rent growth), your $28k cash investment doubles in ~7 years — after that, you're playing with house money.
Negotiation context
- It's been on market 27 days — a 2% lower offer ($98k) is reasonable based on typical stale-listing flexibility.
- 2 sale attempts since 2y ago; this cycle's ask has dropped $90k (47%) from the opening price — seller is motivated, your offer sets the floor, not the list.
Risks & watch-outs
- Watch-outs: property tax is 3.5% of price; built in 1940 — expect roof / HVAC / electrical / plumbing capex.
- Climate carrying-cost: major wind risk, 78% chance of damaging wind over 30y; extreme-heat days projected 7→22/yr by 2055 (HVAC capex compounding) — expect insurance premiums to compound above CPI over the hold.
Questions for the listing agent
- Built in 1940 — when were the roof, HVAC, electrical panel, plumbing, and water heater last replaced?
- Property tax is high relative to price — has the assessment been appealed recently, and will the sale trigger a re-assessment?
- Is there a deadline driving the sale (1031 exchange, divorce, estate, relocation)? That informs how much negotiation room exists.
- Crime grade is F in this area — have there been break-ins, vandalism, or insurance claims at this property in the last 3 years? What carrier currently insures it and at what premium?
- What's the average days-on-market for RENTAL listings here right now (not sales)? A rising rental-DOM trend means longer vacancies and softer asking-rent achievability than the comps imply.
- What's the recent tenant-quality profile in this submarket — average credit score on applications, eviction rate, late-payment / NSF rate, and stable-employment percentage? A property-management company in the area should have these aggregated.
- How much new for-sale + rental construction is in the pipeline within 1–3 miles? Heavy new supply typically softens prices + rents 12–24 months out; constrained supply supports both.
Investment metrics
- 1% rule
- 1.43% ✓
- Cap rate
- 9.55%
- Cash-on-cash
- 11.62%
- DSCR
- 1.52
- GRM
- 5.8
CMA / ARV
- ARV (median comp)
- $180,881
- List price
- $99,500
- Delta
- -19.84%
- Verdict
- UNDERPRICED
- Comps
- 20 within 1.0 mi
Show comp detail 12 sales within ~0.75 mi
| Address | Dist | Beds/Ba | Sqft | Sold | Price | $/sf | Match |
|---|---|---|---|---|---|---|---|
| 1201 Brighton | 0.19mi | 3/2.0 | 1,259 (+7%) | 2mo | $260,000 | $207 | 78 |
| 1214 Chalmers Ave | 0.21mi | 3/2.0 | 1,261 (+7%) | 1mo | $229,900 | $182 | 77 |
| 1229 Flanders Ave | 0.13mi | 3/2.0 | 1,295 (+10%) | 1mo | $230,000 | $178 | 76 |
| 1407 Crystal | 0.16mi | 3/2.0 | 1,104 (-6%) | 8mo | $165,000 | $149 | 76 |
| 318 Elks | 0.19mi | 3/2.0 | 1,000 (-15%) | 4mo | $155,000 | $155 | 63 |
| 1166 Fitch | 0.39mi | 3/2.0 | 1,292 (+10%) | 3mo | $225,000 | $174 | 63 |
| 1161 Fitch | 0.36mi | 3/2.0 | 1,300 (+10%) | 6mo | $235,000 | $181 | 61 |
| 702 Berlin | 0.56mi | 3/1.0 | 1,296 (+10%) | 7mo | $100,000 | $77 | 47 |
| 503 Vickers | 0.63mi | 3/2.0 | 1,328 (+13%) | 4mo | $183,900 | $138 | 46 |
| 26 Vickers | 0.72mi | 3/1.0 | 1,047 (-11%) | 6mo | $169,500 | $162 | 39 |
| 122 Hoover | 0.72mi | 2/1.0 (-1) | 1,034 (-12%) | 1mo | $170,000 | $164 | 36 |
| 815 Flanders | 0.69mi | 2/1.5 (-1) | 1,024 (-13%) | 7mo | $165,000 | $161 | 34 |
Match score weights: distance 35% · size 25% · config 20% · recency 20%. Top-matched comps best support the ARV.
Projected returns pro-forma
-0.45% appreciation · 3.0% rent growth · sell at horizon
- IRR
- 9.5%
- Equity multiple
- 1.44×
- Total profit
- $12,306
- Equity at exit
- $26,677
- IRR
- 15.0%
- Equity multiple
- 2.58×
- Total profit
- $44,080
- Equity at exit
- $30,350
Cash invested: $27,860 (down + closing). Projections, not guarantees.
Landlord ↔ Tenant lean methodology
- Overall (STATE)
- 87 Strongly Landlord-Friendly
- State Texas
- 87 Strongly Landlord-Friendly · R+5
- County
- — inherits STATE
- City
- — inherits STATE
ZIP-level market 78211
- Home prices YoY
- -0.2%
- Active inventory
- 152
- Price-to-rent
- 5.8×
Monthly cashflow live
- Estimated rent
- $1,420 high interval (Pro) →
- Mortgage (P&I)
- −$522
- Tax from tax record
- −$289 /mo · $3,467/yr
- Insurance
- −$41
- HOA
- −$0
- Vacancy / Maint / Mgmt
- −$298
- Net cashflow
- $270
Break-even live
UW: 25.0% down · 7.5% · 30yr · 1.5% tax · 5.0% vac · 8.0% maint · 8.0% mgmt
Financing live
Cash to close
- Down payment
- $24,875
- Closing costs
- $2,985
- Reserves months
- —
- Total cash needed
- —
Loan-product check · same deal, 3 products live
Conventional
25% down · 7.5% · 30yr
- Down + closing
- —
- Monthly P&I
- —
- Monthly cashflow
- —
- DSCR
- —
- Eligible?
- —
Personal DTI + credit; lowest rate.
DSCR
20% down · 8.5% · 30yr
- Down + closing
- —
- Monthly P&I
- —
- Monthly cashflow
- —
- DSCR
- —
- Eligible?
- —
No personal income docs; deal must DSCR.
Hard money
10% down · 12.0% · 12mo
- Down + closing
- —
- Monthly P&I
- —
- Monthly cashflow
- —
- DSCR
- —
- Eligible?
- —
Short-term bridge; refi at stabilization.
Rent comps 30 comps
| Address | Beds | Baths | Sqft | Rent | $/sqft | DOM | Units | Dist |
|---|---|---|---|---|---|---|---|---|
| 1222 Brighton Ave Unit B San Antonio, TX | 3.0 | 1.0 | 725 | $999 | $1.38 | 17d | 1 | 0.16mi |
| 909 Sims Ave San Antonio, TX | 4.0 | 2.0 | 1400 | $1,750 | $1.25 | 23d | 1 | 0.53mi |
| 1130 Sims Ave San Antonio, TX | 3.0 | 2.0 | 1206 | $1,300 | $1.08 | 23d | 1 | 0.56mi |
| 834 Division Ave San Antonio, TX | 2.0 | 1.0 | 700 | $1,050 | $1.50 | 23d | 1 | 0.57mi |
| 834 Division Ave Unit 2 San Antonio, TX | 2.0 | 1.0 | 936 | $950 | $1.01 | 4d | 1 | 0.57mi |
| 616 Sims Ave San Antonio, TX | 3.0 | 1.0 | 1148 | $875 | $0.76 | 43d | 1 | 0.62mi |
| 620 Linden Ave Unit 2 San Antonio, TX | 2.0 | 1.0 | 733 | $1,200 | $1.64 | 43d | 1 | 0.68mi |
| 1467 W Gerald Ave San Antonio, TX | 3.0 | 2.5 | 1120 | $1,300 | $1.16 | 10d | 1 | 0.72mi |
| 422 Wagner Ave San Antonio, TX | 3.0 | 2.0 | 1220 | $1,750 | $1.43 | 43d | 1 | 0.80mi |
| 118 Carthage Ct San Antonio, TX | 3.0 | 2.0 | 1368 | $1,450 | $1.06 | 17d | 1 | 0.93mi |
| 923 Whitman Ave San Antonio, TX | 4.0 | 2.0 | 1208 | $1,700 | $1.41 | 14d | 1 | 0.95mi |
| 150 Hearne San Antonio, TX | 2.0 | 1.0 | 1044 | $1,400 | $1.34 | 23d | 1 | 0.95mi |
| 575 Division Ave San Antonio, TX | 3.0 | 1.5 | 1362 | $1,950 | $1.43 | 17d | 1 | 0.98mi |
| 503 W Hart Ave San Antonio, TX | 3.0 | 1.0 | 1232 | $1,750 | $1.42 | 10d | 1 | 0.98mi |
| 463 Linares St San Antonio, TX | 3.0 | 1.0 | 1220 | $1,400 | $1.15 | 23d | 1 | 0.99mi |
| 737 W Mayfield Blvd San Antonio, TX | 3.0 | 1.0 | 1150 | $1,462 | $1.27 | 43d | 1 | 1.11mi |
| 611 Brunswick Blvd San Antonio, TX | 3.0 | 2.0 | 1080 | $1,700 | $1.57 | 23d | 1 | 1.13mi |
| 611 Brunswick Blvd San Antonio, TX | 3.0 | 2.0 | 1080 | $1,700 | $1.57 | 14d | 1 | 1.13mi |
| 607 Brunswick Blvd San Antonio, TX | 3.0 | 2.0 | 1350 | $1,750 | $1.30 | 43d | 1 | 1.14mi |
| 415 Chalmers Ave San Antonio, TX | 2.0 | 1.0 | 1340 | $1,200 | $0.90 | 23d | 1 | 1.18mi |
| 161 Kaine St San Antonio, TX | 3.0 | 1.0 | 1000 | $1,450 | $1.45 | 17d | 1 | 1.28mi |
| 838 McCauley Blvd San Antonio, TX | 3.0 | 2.0 | 1009 | $1,646 | $1.63 | 14d | 1 | 1.31mi |
| 450 Taft Blvd San Antonio, TX | 3.0 | 1.0 | 883 | $1,295 | $1.47 | 43d | 1 | 1.35mi |
| 134 Gladstone St San Antonio, TX | 2.0 | 1.0 | 1407 | $1,000 | $0.71 | 10d | 1 | 1.35mi |
| 2114 Jupiter St San Antonio, TX | 3.0 | 3.0 | 1233 | $1,457 | $1.18 | 21d | 1 | 1.37mi |
| 329 Taft Blvd San Antonio, TX | 2.0 | 2.0 | 862 | $2,200 | $2.55 | 1d | 1 | 1.38mi |
| 815 Ripford St San Antonio, TX | 2.0 | 1.0 | 728 | $1,300 | $1.79 | 4d | 1 | 1.42mi |
| 626 Kirk Pl San Antonio, TX | 2.0 | 1.0 | 912 | $1,100 | $1.21 | 19d | 1 | 1.44mi |
| 3103 Neptune St San Antonio, TX | 3.0 | 2.0 | 1008 | $1,350 | $1.34 | 43d | 1 | 1.45mi |
| 326 Stonewall St San Antonio, TX | 3.0 | 1.0 | 1080 | $1,200 | $1.11 | 23d | 1 | 1.46mi |
Listing history 24 events
-
2026-06-18days on market $99,500 Active 27 DOM
-
2026-06-17days on market $99,500 Active 26 DOM
-
2026-06-16days on market $99,500 Active 25 DOM
-
2026-06-15days on market $99,500 Active 24 DOM
-
2026-06-13statusdays on market $99,500 Active 22 DOM
-
2026-06-13days on market $99,500 Price Change 21 DOM
-
2026-06-09days on market $99,500 Price Change 18 DOM
-
2026-06-08days on market $99,500 Price Change 17 DOM
-
2026-06-07days on market $99,500 Price Change 16 DOM
-
2026-06-04days on market $99,500 Price Change 13 DOM
-
2026-06-03days on market $99,500 Price Change 12 DOM
-
2026-06-02pricestatusdays on market $99,500 Price Change 11 DOM
-
2026-06-01days on market $110,000 New 10 DOM
-
2026-05-31days on market $110,000 New 9 DOM
-
2026-05-02historical
-
2026-02-08price $145,000
-
2025-10-02price $150,000
-
2025-07-31status Back on Market
-
2025-05-02historical
-
2024-11-14price $169,000
-
2024-07-17price $179,000
-
2024-07-17price $184,000
-
2024-05-09$189,000 New
-
2005-12-19soldstatus
ⓘ Source: listings_history table (triggers on properties + properties_extension) + one-shot
backfill from property_details.listing_events for pre-trigger history.
Tax reassessment forecast TX · Resets to sale price
- Current annual tax
- $3,467 · $289/mo
- Projected year-2 tax
- $3,467 · $289/mo
- Expected delta
- $0/yr ($0/mo · 0.0%)
ⓘ Screening estimate from a state-policy table — verify with the county assessor before closing.
Climate risk First Street
- Flood 3/10 Moderate FEMA zone X (unshaded) · 20% chance over 30 yrs
- Wildfire 1/10 Low
- Heat 8/10 Severe 7 d/yr ≥108°F today · 22 d/yr by 30 yrs out
- Wind 7/10 Severe 78% chance of damaging wind over 30 yrs
- Air quality 2/10 Low 1 unhealthy d/yr today · 2 by 30 yrs out
Nearby sold comps map
Loading sold comps map…
Walkable amenities ~0.75 mi
Loading nearby amenities…
Taxation est. · year 1
- Rental income
- $17,041
- − Mortgage interest
- −$5,574
- − Property taxes
- −$3,467
- − Insurance
- −$498
- − Repairs & maintenance
- −$1,363
- − Management
- −$1,363
- − Depreciation
- −$2,895
- Taxable income
- $1,882
- Est. tax owed @ 24.0%
- −$452
- After-tax cash flow
- $2,785/yr
For passive investors: Depreciation is non-cash, so a rental often shows a tax loss while cash-flowing — sheltering income. Rental losses are passive: they offset passive income freely, and up to $25,000/yr can offset ordinary (W-2) income if you actively participate and your MAGI is under $100k (phasing out to $0 by $150k); unused losses carry forward. On sale, claimed depreciation is recaptured at up to 25%, and gains may owe capital-gains tax (a 1031 exchange can defer both). Figures are a year-1 estimate at your 24.0% rate — not tax advice; consult a CPA.
Schools (NCES district)
- District
- Harlandale ISD
- NCES district ID
- 4822470
- Math proficiency
- 20% ▼ -22.00%
- Reading proficiency
- 27% ▼ -9.00%
- Median HH income
- $33,850
- Composite
- 19.25/100
- National rank
- #8806
- State rank
- #748 of 826 in TX
Livability — San Antonio
- Score
- 80/100
- State rank
- #31
- US rank
- #1616
Category grades
Schools grade is shown separately in the Schools card above.
Census & demographics
- Census place
- San Antonio, TX
- County
- Bexar County · 1,990,555 people
- City population
- 1,806,925
- Metro
- San Antonio-New Braunfels, TX
- Population (ZIP)
- 30,857
- Household income
- $55,436
- Rent vs Own
- Severe rent burden
- 729.0
Population outlook (Bexar County) Hauer SSP2
- Today (2025)
- 2,336,851 people
- By 2030
- 2,560,728 · +9.6%
- By 2040
- 3,020,569 · +29.3%
- By 2050
- 3,493,522 · +49.5%
- By 2075
- 4,668,459 · +99.8%
- By 2100
- 5,533,242 · +136.8%
Race, ethnicity, and origin ACS 2023
- Neighborhood character
- Predominantly Hispanic (93%)
- Race & ethnicity
- Hispanic / Latino 93% Two or more races 30% White 5% Black 1% Native American 1%
- Hispanic origin (detail)
- Mexican 76%
- Foreign-born
- 18% · Canada
- Languages at home
- 35% English-only · Spanish 65%
Political lean MEDSL · Bexar
- 2024 margin
- Lean D (+9.8) · D 54.3% · R 44.6% · Other 1.1%
- 2008→2024 swing
- +4.2pp toward D · 2008: 5.6pp · 2024: 9.8pp
- All cycles
- 2024: D+9.8 2020: D+18.2 2016: D+13.5 2012: D+4.6 2008: D+5.6
Not yet ingested
- Civics
- —
Market trends
- HPI YoY
- ▼ -0.45%
- Current HPI
- 241.1709
- Rent YoY
- —
- Metro
- San Antonio-New Braunfels, TX
- State GDP YoY
- ▲ 3.95%
- F500 in state
- 110
Industry mix (Fortune 500 HQ in TX)
| Industry | F500 HQs | Revenue |
|---|---|---|
| Energy | 16 | $1,198B |
|
||
| Technology | 5 | $198B |
|
||
| Engineering / Construction | 4 | $72B |
|
||
| Energy Services | 3 | $60B |
|
||
| Utilities | 3 | $41B |
|
||
| Healthcare | 2 | $330B |
|
||
Price history
-23.3% since first listed10 events — show timeline
- 2026-05-02 Listing Removed — LERA
- 2026-02-08 Price Changed $145,000 LERA
- 2025-10-02 Price Changed $150,000 LERA
- 2025-07-31 Relisted — LERA
- 2025-05-02 Listing Removed — LERA
- 2024-11-14 Price Changed $169,000 LERA
- 2024-07-17 Price Changed $179,000 LERA
- 2024-07-17 Price Changed $184,000 LERA
- 2024-05-09 Listed $189,000 LERA
- 2005-12-19 Sold (Public Records) — Public Records
Property tax history
+10.1%/yrLatest (2025): $3,467 · -4.0% YoY. Source: county tax records.
Cash-flow waterfall
monthlySold comps — $/sqft
last 12 mo · ≤1 miLoading sold comps…