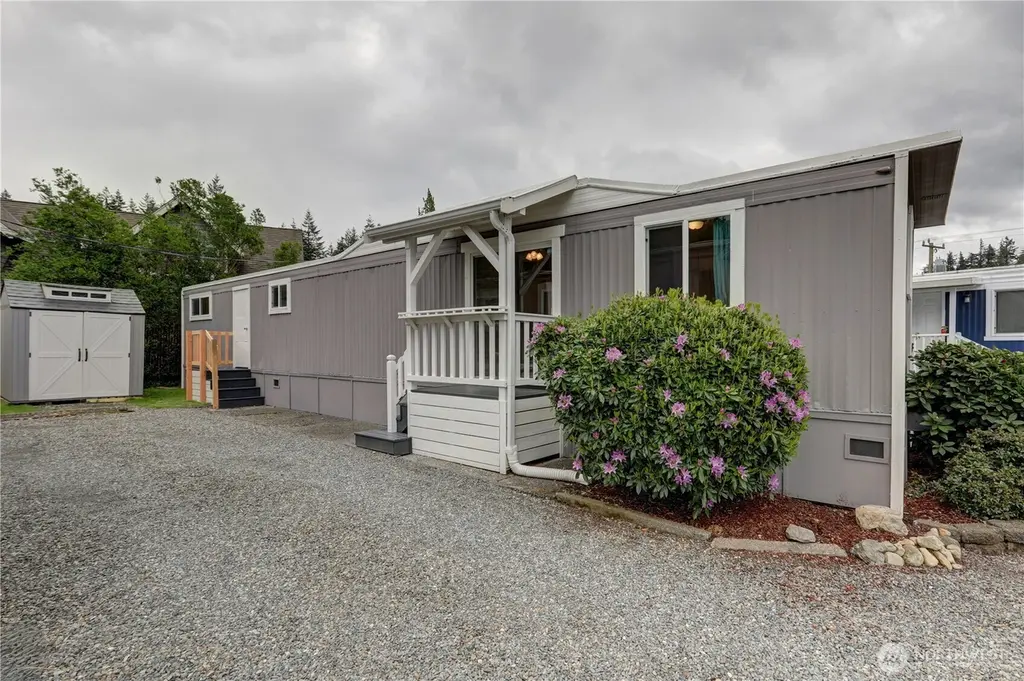
45800 SE North Bend Way #16
North Bend, WA 98045
$92,500B
2 bd · 1.0 ba ·
710 sqft ·
Built 1965
· Manufactured
· Pending
· 21 DOM
Cashflow @ list (25.0% down · 7.5%)
Estimated rent
$2,138/mo
Mortgage (P&I)
−$485
Tax + insurance
−$154
HOA
−$0
Vac / Maint / Mgmt
−$449
Net cashflow
$1,050/mo
Annual
$12,597/yr
Cap rate
19.91%
Cash-on-cash
48.64%
DSCR
3.16
1% rule
2.31%
Cash to close
$25,900
Investor read
- This is a 2-bed/1.0-bath manufactured listed at $92k. Condition is rated good.
- At list price, monthly cash flow is $1k ($13k/yr) — positive.
- The deal already cash-flows at list — no discount required.
- Meets the 1% rule at list price ($2k rent vs $92k).
- It's been on market 21 days — a 2% lower offer ($91k) is reasonable based on typical stale-listing flexibility.
- Recommended offer: $91k (1.5% below list) — sets the bar for market timing.
- Local home prices are declining (-3.0%/yr); year-one equity from $640 of loan paydown is wiped out by about $3k of value loss. Plan a longer hold.
- Location reads 73/100 on livability (#187 in WA) — a middle-class / working-renter tenant base. Strengths: employment A+, housing A+, crime B+; Watch: amenities C-, commute F, cost of living F.
- Snoqualmie Valley School District (town): math 73% / reading 80% proficiency, ranked #5 of 291 in WA (top 2%) — strong family-tenant draw, lease renewals of 3-5y typical; only 10% free/reduced lunch — higher-income household profile.
- Zoned schools: Mount Si High School (2,081 students, 13% FRL) — zoned schools at 13% FRL track the district average.
- Market conditions: Rents rising fast (+7.8%/yr); 147 active listings in the ZIP; 2 comparable units currently listed for rent nearby; high-income renter base; 10,555 units permitted in King County in 2024 (7,119 in 5+ unit buildings).
- King County population projected at +44% by 2050 — long-run rental-demand tailwind backs the buy-and-hold thesis.
- 2 sale attempts since 5y ago with the ask held roughly flat each time — persistent listings suggest the price (not the market) is what's stuck; bring a comps-based counter.
- Current owner paid $57k; list at $92k implies a 62% gain — meaningful room to come down on a strong offer.
- At projected returns (-3.0% appreciation + 7.8% rent growth), your $26k cash investment doubles in ~3 years — after that, you're playing with house money.
- Cap rate 19.9% vs local median 1.5% in North Bend — top-decile yield for the area; either an underpriced asset or a hidden risk that comps aren't pricing in. Stress-test before assuming the spread holds.
- This rent is only 15% of the median local income ($176k/yr) — well below the 30% rent-burden line; pricing power to push rent on renewal without tenant pushback.
Questions for listing agent
- Built in 1965 — when were the roof, HVAC, electrical panel, plumbing, and water heater last replaced?
- Is there a deadline driving the sale (1031 exchange, divorce, estate, relocation)? That informs how much negotiation room exists.
- Schools are A-rated — typically a magnet for longer-tenancy family renters. What's the average tenant stay here, and is there a school-zone premium baked into asking?
- What's the average days-on-market for RENTAL listings here right now (not sales)? A rising rental-DOM trend means longer vacancies and softer asking-rent achievability than the comps imply.
- What's the recent tenant-quality profile in this submarket — average credit score on applications, eviction rate, late-payment / NSF rate, and stable-employment percentage? A property-management company in the area should have these aggregated.
- How much new for-sale + rental construction is in the pipeline within 1–3 miles? Heavy new supply typically softens prices + rents 12–24 months out; constrained supply supports both.
CashFlowRE · CFR-A4THBRC77F4YFS
· Data 1 week ago
cashflowre.app · 2026-05-29