45800 SE North Bend Way #16 · North Bend, WA
Flood risk 1/10 · Minimal
- FEMA flood zone
- D
- Chance of flooding over 30 yrs
- 0.0%
- Est. flood insurance / yr
- $544 – $1,084
Fire risk 3/10 · Minor
- Est. fire insurance / yr
- $604 – $1,122
Heat risk 2/10 · Minimal
- Hot days now (above 84°F)
- 9 days/yr
- Hot days in 30 yrs
- 20 days/yr
Wind risk 1/10 · Minimal
- Chance of severe wind over 30 yrs
- —
Air-quality risk 8/10 · Major
- Unhealthy air days now
- 11 days/yr
- Unhealthy air days in 30 yrs
- 17 days/yr
Risk factors via First Street. Map © Google.
Why this score? — see what drove the B grade
The composite is a weighted blend of 9 inputs, each scored 0–100. Each bar is that input's sub-score; the figure is the points it added to the 100-point composite (weight × sub-score).
- Cash flow +30.0/30.0
- 1% rule +10.0/10.0
- DSCR +10.0/10.0
- Schools +7.1/10.0
- ARV discount +4.8/15.0
- Rent growth +4.4/5.0
- Condition / age +4.0/5.0
- Livability +3.7/5.0
- Appreciation +0.0/10.0
$92,500
🖨 Deal sheet 📄 Offer letter ✓ Due diligence
Listing remarks
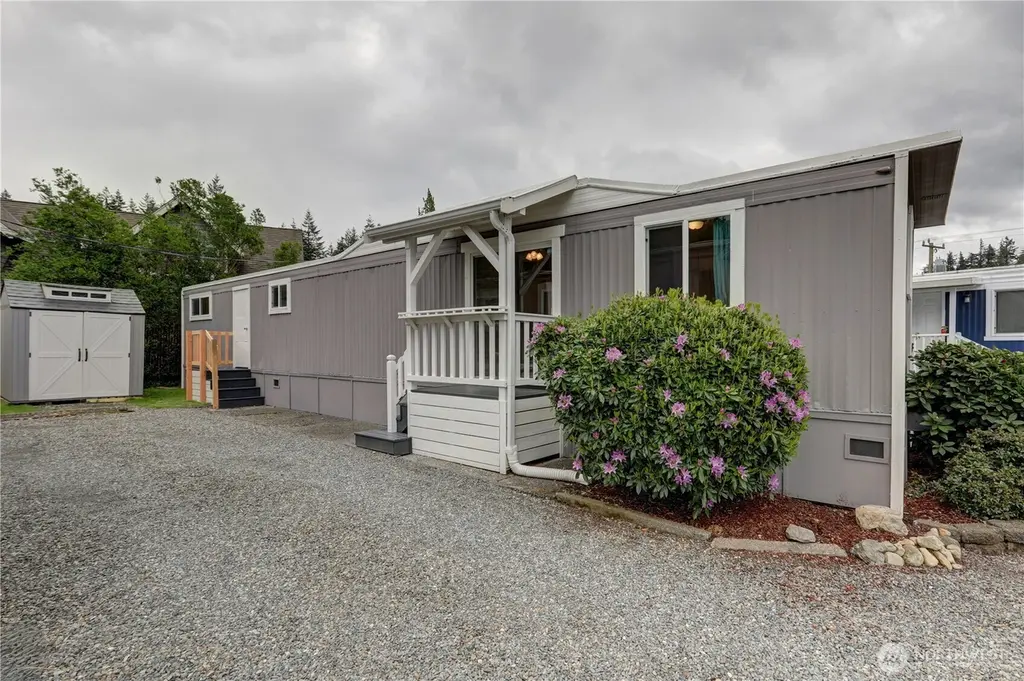
Fall in love with this darling home nestled in scenic North Bend with gorgeous Mt. Si views right outside your window! This super cute, move-in ready 2-bedroom home is filled with charm and thoughtful updates, including beautiful vinyl plank flooring, fresh paint, an updated bathroom, and a bright, refreshed kitchen perfect for cozy mornings and gathering with friends. Enjoy peaceful mountain and territorial views while being just minutes from shopping, restaurants, parks, trails, and easy I-90 access. Monthly space rent includes water, sewer, and lawn service. No age restrictions. Owner-occupied and park approval required. Come see why this sweet home is such a special find!
Key facts
- Mt si views
- Updated bathroom
- Refreshed kitchen
Tags
Property features AI
Finance
- Other: Buyer to verify school information; Bus line nearby
- Financial info: Land lease: $1,149 (monthly); Listing terms: Cash or Conventional
- HOA & community: Park approved for sale; NorWest park with 24 homes; Playground and trails in the park; Cats allowed
Exterior
- Parking: 2 open uncovered parking spaces
- Utilities: Electric energy source; Electric water heater (located in spare bedroom); Community water (park); Sewer via park; Power provided by Tanner Electric; Cable: Comcast; Internet: Comcast
- Home design: Manufactured single-wide home; Updated/remodeled condition; One story; Make: Elcar, Model: 60D/12; Mobile home remains on site
- Construction: Metal/vinyl construction; Pillar/post/pier foundation with tie downs
- Exterior features: Metal/vinyl exterior; Paved lot
Interior
- Kitchen: Dishwasher; Refrigerator; Stove/Range; Kitchen with eating space
- Bedrooms: 2 bedrooms
- Flooring: Vinyl plank
- Bathrooms: 1 full bathroom
- Heating & cooling: Forced air heating; No central air
- Interior features: Water heater; Awnings; Ceiling fan(s); Double-pane windows; Patio/porch/deck; Vaulted ceilings
- Laundry & utility: Washer; Dryer; Utility room
Neighborhood map
What this means for you Summary
Snapshot
- This is a 2-bed/1.0-bath manufactured listed at $92k. Condition is rated good.
Deal economics
- At list price, monthly cash flow is $1k ($13k/yr) — positive.
- The deal already cash-flows at list — no discount required.
- Meets the 1% rule at list price ($2k rent vs $92k).
- Recommended offer: $91k (1.5% below list) — sets the bar for market timing.
- Cap rate 19.9% vs local median 1.5% in North Bend — top-decile yield for the area; either an underpriced asset or a hidden risk that comps aren't pricing in. Stress-test before assuming the spread holds.
Location & tenants
- Location reads 73/100 on livability (#187 in WA) — a middle-class / working-renter tenant base. Strengths: employment A+, housing A+, crime B+; Watch: amenities C-, commute F, cost of living F.
- Snoqualmie Valley School District (town): math 73% / reading 80% proficiency, ranked #5 of 291 in WA (top 2%) — strong family-tenant draw, lease renewals of 3-5y typical; only 10% free/reduced lunch — higher-income household profile.
- Zoned schools: Mount Si High School (2,081 students, 13% FRL) — zoned schools at 13% FRL track the district average.
- Market conditions: Rents rising fast (+7.8%/yr); 147 active listings in the ZIP; 2 comparable units currently listed for rent nearby; high-income renter base; 10,555 units permitted in King County in 2024 (7,119 in 5+ unit buildings).
- This rent is only 15% of the median local income ($176k/yr) — well below the 30% rent-burden line; pricing power to push rent on renewal without tenant pushback.
Forward outlook
- Local home prices are declining (-3.0%/yr); year-one equity from $640 of loan paydown is wiped out by about $3k of value loss. Plan a longer hold.
- King County population projected at +44% by 2050 — long-run rental-demand tailwind backs the buy-and-hold thesis.
- At projected returns (-3.0% appreciation + 7.8% rent growth), your $26k cash investment doubles in ~3 years — after that, you're playing with house money.
Negotiation context
- It's been on market 21 days — a 2% lower offer ($91k) is reasonable based on typical stale-listing flexibility.
- 2 sale attempts since 5y ago with the ask held roughly flat each time — persistent listings suggest the price (not the market) is what's stuck; bring a comps-based counter.
- Current owner paid $57k; list at $92k implies a 62% gain — meaningful room to come down on a strong offer.
Questions for the listing agent
- Built in 1965 — when were the roof, HVAC, electrical panel, plumbing, and water heater last replaced?
- Is there a deadline driving the sale (1031 exchange, divorce, estate, relocation)? That informs how much negotiation room exists.
- Schools are A-rated — typically a magnet for longer-tenancy family renters. What's the average tenant stay here, and is there a school-zone premium baked into asking?
- What's the average days-on-market for RENTAL listings here right now (not sales)? A rising rental-DOM trend means longer vacancies and softer asking-rent achievability than the comps imply.
- What's the recent tenant-quality profile in this submarket — average credit score on applications, eviction rate, late-payment / NSF rate, and stable-employment percentage? A property-management company in the area should have these aggregated.
- How much new for-sale + rental construction is in the pipeline within 1–3 miles? Heavy new supply typically softens prices + rents 12–24 months out; constrained supply supports both.
Investment metrics
- 1% rule
- 2.31% ✓
- Cap rate
- 19.91%
- Cash-on-cash
- 48.64%
- DSCR
- 3.16
- GRM
- 3.6
CMA / ARV
- ARV (median comp)
- $87,354
- List price
- $92,500
- Delta
- 5.89%
- Verdict
- FAIR
- Comps
- 1 within 2.0 mi
Show comp detail 2 sales within ~0.75 mi
| Address | Dist | Beds/Ba | Sqft | Sold | Price | $/sf | Match |
|---|---|---|---|---|---|---|---|
| 45800 SE North Bend Way #14 | 0.00mi | 2/1.0 | 784 (+10%) | 6mo | $87,000 | $111 | 78 |
| 45800 SE North Bend Way #12 | 0.00mi | 2/1.0 | 756 (+6%) | 19mo | $110,000 | $146 | 73 |
Match score weights: distance 35% · size 25% · config 20% · recency 20%. Top-matched comps best support the ARV.
Projected returns pro-forma
-3.0% appreciation · 7.77% rent growth · sell at horizon
- IRR
- 51.5%
- Equity multiple
- 3.42×
- Total profit
- $62,659
- Equity at exit
- $13,792
- IRR
- 58.8%
- Equity multiple
- 8.32×
- Total profit
- $189,500
- Equity at exit
- $7,998
Cash invested: $25,900 (down + closing). Projections, not guarantees.
Landlord ↔ Tenant lean methodology
- Overall (STATE)
- 28 Tenant-Leaning
- State Washington
- 28 Tenant-Leaning · D+8
- County
- — inherits STATE
- City
- — inherits STATE
ZIP-level market 98045
- Rents YoY
- 7.8%
- Active inventory
- 147
- Price-to-rent
- 3.6×
Monthly cashflow live
- Estimated rent
- $2,138 medium interval (Pro) →
- Mortgage (P&I)
- −$485
- Tax est. 1.5%
- −$116 /mo · $1,388/yr
- Insurance
- −$39
- HOA
- −$0
- Vacancy / Maint / Mgmt
- −$449
- Net cashflow
- $1,050
Break-even live
UW: 25.0% down · 7.5% · 30yr · 1.5% tax · 5.0% vac · 8.0% maint · 8.0% mgmt
Financing live
Cash to close
- Down payment
- $23,125
- Closing costs
- $2,775
- Reserves months
- —
- Total cash needed
- —
Loan-product check · same deal, 3 products live
Conventional
25% down · 7.5% · 30yr
- Down + closing
- —
- Monthly P&I
- —
- Monthly cashflow
- —
- DSCR
- —
- Eligible?
- —
Personal DTI + credit; lowest rate.
DSCR
20% down · 8.5% · 30yr
- Down + closing
- —
- Monthly P&I
- —
- Monthly cashflow
- —
- DSCR
- —
- Eligible?
- —
No personal income docs; deal must DSCR.
Hard money
10% down · 12.0% · 12mo
- Down + closing
- —
- Monthly P&I
- —
- Monthly cashflow
- —
- DSCR
- —
- Eligible?
- —
Short-term bridge; refi at stabilization.
Rent comps 2 comps
| Address | Beds | Baths | Sqft | Rent | $/sqft | DOM | Units | Dist |
|---|---|---|---|---|---|---|---|---|
| 45414 SE North Bend Way Unit 4 North Bend, WA | 1.0 | 1.0 | 468 | $1,550 | $3.31 | 4d | 1 | 0.25mi |
| 45414 SE North Bend Way North Bend, WA | 1.0 | 1.0 | 468 | $1,550 | $3.31 | 2d | 1 | 0.25mi |
Listing history 13 events
-
2026-06-07statusdays on market $92,500 Pending 21 DOM
-
2026-06-04days on market $92,500 Active 20 DOM
-
2026-06-03days on market $92,500 Active 19 DOM
-
2026-06-02days on market $92,500 Active 18 DOM
-
2026-06-01days on market $92,500 Active 17 DOM
-
2026-05-31days on market $92,500 Active 16 DOM
-
2026-05-15$92,500 Active
-
2022-03-02soldstatus $57,000 Closed
-
2022-01-16status Pending
-
2021-11-27price $64,000
-
2021-10-30price $67,000
-
2021-08-20price $69,000
-
2021-07-28$79,000 Active
ⓘ Source: listings_history table (triggers on properties + properties_extension) + one-shot
backfill from property_details.listing_events for pre-trigger history.
Climate risk First Street
- Flood 1/10 Low FEMA zone D · 0% chance over 30 yrs
- Wildfire 3/10 Moderate
- Heat 2/10 Low 9 d/yr ≥84°F today · 20 d/yr by 30 yrs out
- Wind 1/10 Low
- Air quality 8/10 Severe 11 unhealthy d/yr today · 17 by 30 yrs out
Nearby sold comps map
Loading sold comps map…
Walkable amenities ~0.75 mi
Loading nearby amenities…
Taxation est. · year 1
- Rental income
- $25,656
- − Mortgage interest
- −$5,181
- − Property taxes
- −$1,388
- − Insurance
- −$462
- − Repairs & maintenance
- −$2,052
- − Management
- −$2,052
- − Depreciation
- −$2,691
- Taxable income
- $11,829
- Est. tax owed @ 24.0%
- −$2,839
- After-tax cash flow
- $9,758/yr
For passive investors: Depreciation is non-cash, so a rental often shows a tax loss while cash-flowing — sheltering income. Rental losses are passive: they offset passive income freely, and up to $25,000/yr can offset ordinary (W-2) income if you actively participate and your MAGI is under $100k (phasing out to $0 by $150k); unused losses carry forward. On sale, claimed depreciation is recaptured at up to 25%, and gains may owe capital-gains tax (a 1031 exchange can defer both). Figures are a year-1 estimate at your 24.0% rate — not tax advice; consult a CPA.
Condition & rehab AI · 13 photos
This move-in ready 2-bedroom home is in good condition with updated interiors and a well-maintained exterior. It offers a great location with scenic views and easy access to amenities.
Value-add opportunities
- Both paint exterior — Fresh paint can enhance curb appeal and make the home look more inviting
- Both landscaping — Well-maintained landscaping can improve curb appeal and add value
- Both HVAC maintenance — Regular HVAC maintenance can improve air quality and energy efficiency, making the home more comfortable and cost-effective to run
Renovation cost estimate screening
Value-add ROI direction
- Both paint exterior — Fresh paint can enhance curb appeal and make the home look more inviting ↑
- Both landscaping — Well-maintained landscaping can improve curb appeal and add value ↑
- Both HVAC maintenance — Regular HVAC maintenance can improve air quality and energy efficiency, making the home more comfortable and cost-effective to run ↑
ⓘ Cost ranges are severity-bucket heuristics (US national rule-of-thumb). Get contractor quotes + a written scope before underwriting a rehab budget.
Schools (NCES district)
- District
- Snoqualmie Valley School District
- NCES district ID
- 5308040
- Math proficiency
- 73% ▬ 0.00%
- Reading proficiency
- 80% ▲ 1.00%
- Median HH income
- $106,540
- Composite
- 71.07/100
- National rank
- #481
- State rank
- #5 of 291 in WA
Livability — North Bend
- Score
- 73/100
- State rank
- #187
- US rank
- #5052
Category grades
Schools grade is shown separately in the Schools card above.
Census & demographics
- Census place
- North Bend, WA
- County
- King County · 2,251,916 people
- City population
- 15,289
- Metro
- Seattle-Tacoma-Bellevue, WA
- Population (ZIP)
- 15,289
- Household income
- $175,765
- Rent vs Own
- Severe rent burden
- 281.0
Population outlook (King County) Hauer SSP2
- Today (2025)
- 2,576,485 people
- By 2030
- 2,803,316 · +8.8%
- By 2040
- 3,255,921 · +26.4%
- By 2050
- 3,706,444 · +43.9%
- By 2075
- 4,746,063 · +84.2%
- By 2100
- 5,407,730 · +109.9%
Race, ethnicity, and origin ACS 2023
- Neighborhood character
- Predominantly White (76%)
- Race & ethnicity
- White 76% Two or more races 12% Hispanic / Latino 10% Asian 4% Native American 2%
- Hispanic origin (detail)
- Mexican 6% Puerto Rican 1%
- Common ancestry
- Slovak 4% Portuguese 3% Lithuanian 3%
- Foreign-born
- 8% · Canada, China, South Korea
- Languages at home
- 90% English-only · Spanish 6% Other Indo-European 1% Tagalog/Filipino 1%
Political lean MEDSL · King
- 2024 margin
- Solid D (+51.7) · D 74.2% · R 22.5% · Other 3.4%
- 2008→2024 swing
- +9.6pp toward D · 2008: 42.1pp · 2024: 51.7pp
- All cycles
- 2024: D+51.7 2020: D+52.7 2016: D+50.4 2012: D+39.9 2008: D+42.1
Not yet ingested
- Civics
- —
Market trends
- HPI YoY
- ▼ -896.51%
- Current HPI
- 341.5636
- Rent YoY
- ▲ 7.77%
- Metro
- Seattle-Tacoma-Bellevue, WA
- State GDP YoY
- ▲ 4.65%
- F500 in state
- 22
Industry mix (Fortune 500 HQ in WA)
| Industry | F500 HQs | Revenue |
|---|---|---|
| Retail | 2 | $269B |
|
||
| Technology / Retail | 1 | $638B |
|
||
| Technology | 1 | $245B |
|
||
| Telecommunications | 1 | $38B |
|
||
| Food / Beverage | 1 | $36B |
|
||
| Automotive / Trucks | 1 | $34B |
|
||
Price history
+17.1% since first listed8 events — show timeline
- 2026-06-05 Pending — NWMLS as Distributed by MLS Grid
- 2026-05-15 Listed $92,500 NWMLS as Distributed by MLS Grid
- 2022-03-02 Sold (MLS) $57,000 NWMLS as Distributed by MLS Grid
- 2022-01-16 Pending — NWMLS as Distributed by MLS Grid
- 2021-11-27 Price Changed $64,000 NWMLS as Distributed by MLS Grid
- 2021-10-30 Price Changed $67,000 NWMLS as Distributed by MLS Grid
- 2021-08-20 Price Changed $69,000 NWMLS as Distributed by MLS Grid
- 2021-07-28 Listed $79,000 NWMLS as Distributed by MLS Grid
Cash-flow waterfall
monthlySold comps — $/sqft
last 12 mo · ≤1 miLoading sold comps…