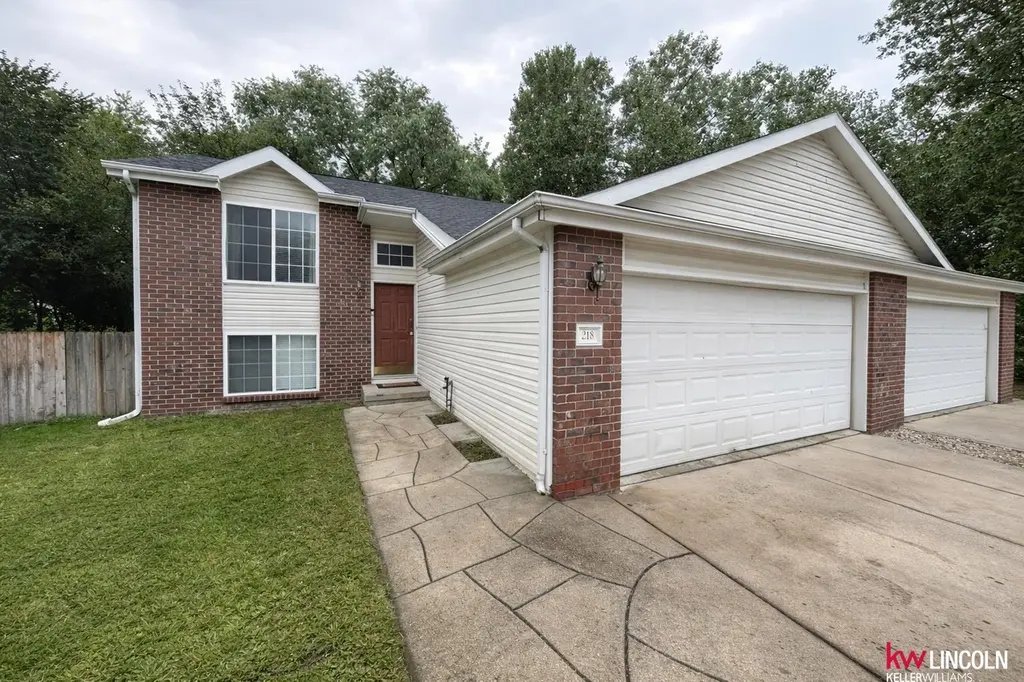
218 W Irving St
Lincoln, NE 68521
$235,000F
2 bd · 2.0 ba ·
1,640 sqft ·
Built 2001
· Townhouse
· Pending
· 11 DOM
Cashflow @ list (25.0% down · 7.5%)
Estimated rent
$1,581/mo
Mortgage (P&I)
−$1,232
Tax + insurance
−$332
HOA
−$0
Vac / Maint / Mgmt
−$332
Net cashflow
$-315/mo
Annual
$-3,785/yr
Cap rate
4.68%
Cash-on-cash
-5.75%
DSCR
0.74
1% rule
0.67%
Cash to close
$65,800
Investor read
- This is a 2-bed/2.0-bath townhouse listed at $235k.
- At list price, monthly cash flow is $-315 ($-4k/yr) — negative.
- To cash-flow at today's rent, offer at most $179k (23.7% below list).
- To meet the 1% rule (rent ≥ 1% of price), the offer needs to be $158k (32.7% below list).
- Only 11 days on market — expect competitive offers; lowballing is unlikely to land.
- Recommended offer: $158k (32.7% below list) — sets the bar for 1% rule.
- Local home prices are declining (-3.0%/yr); year-one equity from $2k of loan paydown is wiped out by about $7k of value loss. Plan a longer hold.
- Location reads 85/100 on livability (#5 in NE, #545 nationally) — a professional / high-income tenant draw. Strengths: amenities A+, cost of living A+, housing A+; Watch: crime D+.
- Lincoln Public Schools (urban): math 50% / reading 53% proficiency, ranked #59 of 111 in NE (top 53%) — acceptable for families but not a draw, mixed tenant base, ~2y average lease.
- Zoned schools: Belmont Elementary School (math 34% / reading 44%, grade F, #371 of 502 statewide, top 74%, 814 students, 0% FRL); Goodrich Middle School (math 38% / reading 36%, grade F, #99 of 128 statewide, top 79%, 877 students, 78% FRL); Lincoln High School (math 38% / reading 41%, grade F, #184 of 261 statewide, top 76%, 2,196 students, 59% FRL).
- Zoned-school proficiency averages 38% at this address vs 52% district-wide (-13 pts) — the specific schools serving this property underperform the Lincoln Public Schools average; the district grade overstates school quality for this exact location.
- Market conditions: Rents rising fast (+4.0%/yr); 372 active listings in the ZIP; 15 comparable units currently listed for rent nearby; rentals at typical pace (median 24d on market — plan ~3-4 weeks tenant-placement turnaround); 47% of comp listings sitting > 30 days — soft ceiling on asking rent; 1,940 units permitted in Lancaster County in 2024 (895 in 5+ unit buildings).
- Lancaster County population projected at +37% by 2050 — long-run rental-demand tailwind backs the buy-and-hold thesis.
- 3 sale attempts with the ask held roughly flat each time — persistent listings suggest the price (not the market) is what's stuck; bring a comps-based counter.
- Current owner paid $128k; list at $235k implies a 83% gain — meaningful room to come down on a strong offer.
- Climate carrying-cost: major flood risk — expect insurance premiums to compound above CPI over the hold.
- Cap rate 4.7% vs local median 3.1% in Lincoln — top-decile yield for the area; either an underpriced asset or a hidden risk that comps aren't pricing in. Stress-test before assuming the spread holds.
Questions for listing agent
- What do current leases actually rent for vs. the listed asking? Can we see a recent rent roll and the last 12 months of T-12 income?
- Is there a deadline driving the sale (1031 exchange, divorce, estate, relocation)? That informs how much negotiation room exists.
- Schools are A-rated — typically a magnet for longer-tenancy family renters. What's the average tenant stay here, and is there a school-zone premium baked into asking?
- Crime grade is D in this area — have there been break-ins, vandalism, or insurance claims at this property in the last 3 years? What carrier currently insures it and at what premium?
- The area grade is low — what's the realistic commute time and amenity access for the typical tenant pool here? Any planned neighborhood developments (good or bad) we should know about?
- What's the average days-on-market for RENTAL listings here right now (not sales)? A rising rental-DOM trend means longer vacancies and softer asking-rent achievability than the comps imply.
- What's the recent tenant-quality profile in this submarket — average credit score on applications, eviction rate, late-payment / NSF rate, and stable-employment percentage? A property-management company in the area should have these aggregated.
- How much new for-sale + rental construction is in the pipeline within 1–3 miles? Heavy new supply typically softens prices + rents 12–24 months out; constrained supply supports both.
CashFlowRE · CFR-A55EZ7BPN7JFYK
· Data 4 weeks ago
cashflowre.app · 2026-05-29