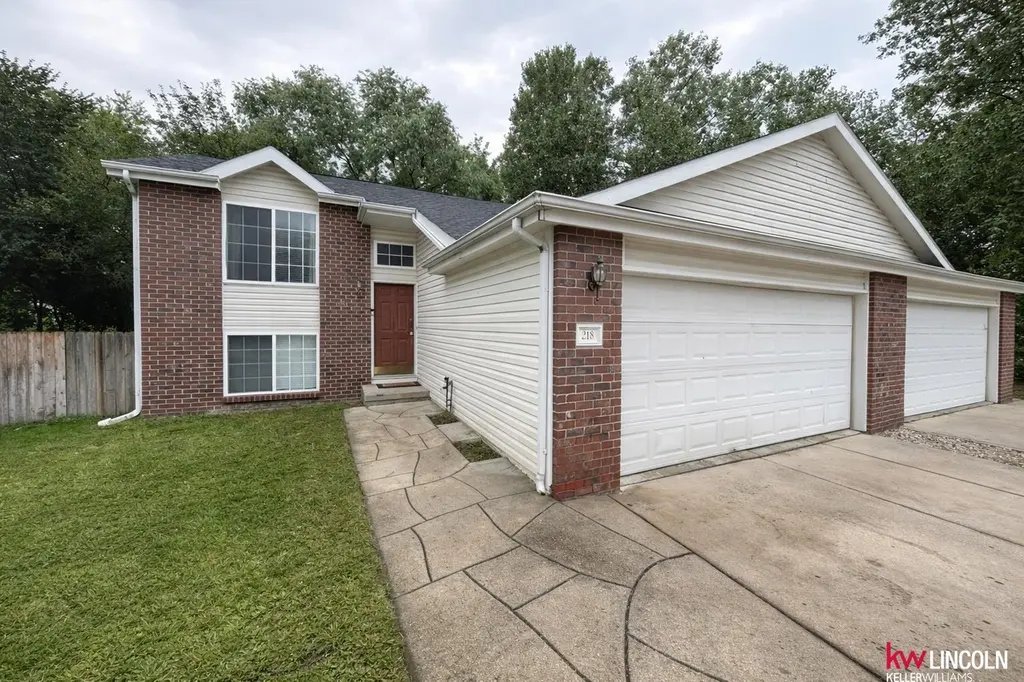
218 W Irving St · Lincoln, NE
Flood risk 6/10 · Moderate
- FEMA flood zone
- X (unshaded)
- Chance of flooding over 30 yrs
- 0.72%
- Est. flood insurance / yr
- $473 – $860
Fire risk 1/10 · Minimal
- Est. fire insurance / yr
- $1,161 – $2,155
Heat risk 3/10 · Minor
- Hot days now (above 105°F)
- 7 days/yr
- Hot days in 30 yrs
- 16 days/yr
Wind risk 2/10 · Minimal
- Chance of severe wind over 30 yrs
- —
Air-quality risk 1/10 · Minimal
- Unhealthy air days now
- 0 days/yr
- Unhealthy air days in 30 yrs
- 0 days/yr
Risk factors via First Street. Map © Google.
Why this score? — see what drove the F grade
The composite is a weighted blend of 9 inputs, each scored 0–100. Each bar is that input's sub-score; the figure is the points it added to the 100-point composite (weight × sub-score).
- Cash flow +7.3/30.0
- Schools +4.4/10.0
- Livability +4.2/5.0
- Rent growth +3.5/5.0
- ARV discount +3.3/15.0
- Condition / age +2.5/5.0
- 1% rule +1.7/10.0
- DSCR +1.4/10.0
- Appreciation +0.0/10.0
$235,000
🖨 Deal sheet (PDF) 📄 Offer letter ✓ Due diligence
Listing remarks
Well-cared-for 4 bedroom, 2 bathroom split-level townhome located in Northwest Lincoln with unbeatable access to downtown, the airport, parks, the interstate, and the university. This home features a functional layout, a 2-stall garage, and brand new LVP flooring throughout, giving it a clean, modern feel from top to bottom. The backyard backs to commons and mature trees, offering a more private and peaceful setting than typically found this close to city conveniences. Whether you're looking for a low-maintenance home or a strong investment opportunity, this property checks all the boxes.
Key facts
- Split-level townhome
- Unbeatable access
- Functional layout
Tags
Neighborhood map
What this means for you Summary
Snapshot
- This is a 2-bed/2.0-bath townhouse listed at $235k.
Deal economics
- At list price, monthly cash flow is $-315 ($-4k/yr) — negative.
- To cash-flow at today's rent, offer at most $179k (23.7% below list).
- To meet the 1% rule (rent ≥ 1% of price), the offer needs to be $158k (32.7% below list).
- Recommended offer: $158k (32.7% below list) — sets the bar for 1% rule.
- Cap rate 4.7% vs local median 3.0% in Lincoln — top-decile yield for the area; either an underpriced asset or a hidden risk that comps aren't pricing in. Stress-test before assuming the spread holds.
Location & tenants
- Location reads 85/100 on livability (#5 in NE, #545 nationally) — a professional / high-income tenant draw. Strengths: amenities A+, cost of living A+, housing A+; Watch: crime D+.
- Lincoln Public Schools (urban): math 50% / reading 53% proficiency, ranked #59 of 111 in NE (top 53%) — acceptable for families but not a draw, mixed tenant base, ~2y average lease.
- Zoned schools: Belmont Elementary School (math 34% / reading 44%, grade F, #371 of 502 statewide, top 74%, 814 students, 0% FRL); Goodrich Middle School (math 38% / reading 36%, grade F, #99 of 128 statewide, top 79%, 877 students, 78% FRL); Lincoln High School (math 38% / reading 41%, grade F, #184 of 261 statewide, top 76%, 2,196 students, 59% FRL).
- Zoned-school proficiency averages 38% at this address vs 52% district-wide (-13 pts) — the specific schools serving this property underperform the Lincoln Public Schools average; the district grade overstates school quality for this exact location.
- Market conditions: Rents rising fast (+4.0%/yr); 371 active listings in the ZIP; 15 comparable units currently listed for rent nearby; rentals at typical pace (median 24d on market — plan ~3-4 weeks tenant-placement turnaround); 47% of comp listings sitting > 30 days — soft ceiling on asking rent; 1,940 units permitted in Lancaster County in 2024 (895 in 5+ unit buildings).
Forward outlook
- Local home prices are declining (-3.0%/yr); year-one equity from $2k of loan paydown is wiped out by about $7k of value loss. Plan a longer hold.
- Lancaster County population projected at +37% by 2050 — long-run rental-demand tailwind backs the buy-and-hold thesis.
Negotiation context
- Only 11 days on market — expect competitive offers; lowballing is unlikely to land.
- 3 sale attempts with the ask held roughly flat each time — persistent listings suggest the price (not the market) is what's stuck; bring a comps-based counter.
- Current owner paid $128k; list at $235k implies a 83% gain — meaningful room to come down on a strong offer.
Risks & watch-outs
- Climate carrying-cost: major flood risk — expect insurance premiums to compound above CPI over the hold.
Questions for the listing agent
- What do current leases actually rent for vs. the listed asking? Can we see a recent rent roll and the last 12 months of T-12 income?
- Is there a deadline driving the sale (1031 exchange, divorce, estate, relocation)? That informs how much negotiation room exists.
- Schools are A-rated — typically a magnet for longer-tenancy family renters. What's the average tenant stay here, and is there a school-zone premium baked into asking?
- Crime grade is D in this area — have there been break-ins, vandalism, or insurance claims at this property in the last 3 years? What carrier currently insures it and at what premium?
- The area grade is low — what's the realistic commute time and amenity access for the typical tenant pool here? Any planned neighborhood developments (good or bad) we should know about?
- What's the average days-on-market for RENTAL listings here right now (not sales)? A rising rental-DOM trend means longer vacancies and softer asking-rent achievability than the comps imply.
- What's the recent tenant-quality profile in this submarket — average credit score on applications, eviction rate, late-payment / NSF rate, and stable-employment percentage? A property-management company in the area should have these aggregated.
- How much new for-sale + rental construction is in the pipeline within 1–3 miles? Heavy new supply typically softens prices + rents 12–24 months out; constrained supply supports both.
Investment metrics
- 1% rule
- 0.67% ✗
- Cap rate
- 4.68%
- Cash-on-cash
- -5.75%
- DSCR
- 0.74
- GRM
- 12.4
CMA / ARV
- ARV (on-the-fly)
- $214,840
- Comps found
- 6
Show comp detail 6 sales within ~0.75 mi
| Address | Dist | Beds/Ba | Sqft | Sold | Price | $/sf | Match |
|---|---|---|---|---|---|---|---|
| 216 W Irving St | 0.01mi | 3/2.0 (+1) | 1,640 (0%) | 4mo | $215,000 | $131 | 91 |
| 272 Parkside Ln | 0.35mi | 3/2.0 (+1) | 1,614 (-2%) | 15mo | $210,000 | $130 | 64 |
| 222 Parkside Ln | 0.29mi | 3/2.0 (+1) | 1,420 (-13%) | 2mo | $226,000 | $159 | 57 |
| 3100 NW 7th St | 0.66mi | 2/2.0 | 1,497 (-9%) | 7mo | $186,500 | $125 | 49 |
| 3202 NW 7th St | 0.59mi | 3/2.0 (+1) | 1,497 (-9%) | 11mo | $190,000 | $127 | 44 |
| 4040 N 8th St | 0.63mi | 3/2.0 (+1) | 1,750 (+7%) | 23mo | $240,000 | $137 | 35 |
Match score weights: distance 35% · size 25% · config 20% · recency 20%. Top-matched comps best support the ARV.
Projected returns pro-forma
-3.0% appreciation · 4.04% rent growth · sell at horizon
- IRR
- -25.1%
- Equity multiple
- 0.14×
- Total profit
- $-56,511
- Equity at exit
- $35,039
- IRR
- -18.4%
- Equity multiple
- -0.04×
- Total profit
- $-68,125
- Equity at exit
- $20,319
Cash invested: $65,800 (down + closing). Projections, not guarantees.
Landlord ↔ Tenant lean methodology
- Overall (STATE)
- 83 Strongly Landlord-Friendly
- State Nebraska
- 83 Strongly Landlord-Friendly · R+13
- County
- — inherits STATE
- City
- — inherits STATE
ZIP-level market 68521
- Home prices YoY
- -34.1%
- Rents YoY
- 4.0%
- Active inventory
- 371
- Price-to-rent
- 12.4×
Monthly cashflow live
- Estimated rent
- $1,581 high interval (Pro) →
- Mortgage (P&I)
- −$1,232
- Tax from tax record
- −$234 /mo · $2,805/yr
- Insurance
- −$98
- HOA
- −$0
- Lot rent
- −$0
- Vacancy / Maint / Mgmt
- −$332
- Net cashflow
- $-315
Break-even live
Sensitivity live
| Price | -10% $-182 | -5% $-249 | +0% $-315 | +5% $-382 | +10% $-448 |
|---|---|---|---|---|---|
| Rent | -10% $-440 | -5% $-378 | +0% $-315 | +5% $-253 | +10% $-191 |
| Rate | -1.0pp $-197 | -0.5pp $-256 | base $-315 | +0.5pp $-376 | +1.0pp $-438 |
UW: 25.0% down · 7.5% · 30yr · 1.5% tax · 5.0% vac · 8.0% maint · 8.0% mgmt
Financing live
Cash to close
- Down payment
- $58,750
- Closing costs
- $7,050
- Reserves months
- —
- Total cash needed
- —
Loan-product check · same deal, 3 products live
Conventional
25% down · 7.5% · 30yr
- Down + closing
- —
- Monthly P&I
- —
- Monthly cashflow
- —
- DSCR
- —
- Eligible?
- —
Personal DTI + credit; lowest rate.
DSCR
20% down · 8.5% · 30yr
- Down + closing
- —
- Monthly P&I
- —
- Monthly cashflow
- —
- DSCR
- —
- Eligible?
- —
No personal income docs; deal must DSCR.
Hard money
10% down · 12.0% · 12mo
- Down + closing
- —
- Monthly P&I
- —
- Monthly cashflow
- —
- DSCR
- —
- Eligible?
- —
Short-term bridge; refi at stabilization.
Rent comps 15 comps
| Address | Beds | Baths | Sqft | Rent | $/sqft | DOM | Units | Dist |
|---|---|---|---|---|---|---|---|---|
| 4441 N 1st St Lincoln, NE | 3.0 | 1.0–2.0 | 853 | $1,490 | $1.75 | 16d | 39 | 0.17mi |
| North Pointe Villas Lincoln, NE | 3.0 | 1.0–2.0 | 1022 | $1,919 | $1.88 | 16d | 25 | 0.24mi |
| 4730 Innovation Dr Lincoln, NE | 2.0 | 1.0–2.5 | 873 | $1,800 | $2.06 | 16d | 1 | 0.55mi |
| 2900 N 1st St Lincoln, NE | 2.0–3.0 | 1.0–2.0 | 1061 | $945 | $0.89 | 46d | 3 | 0.65mi |
| 2801 NW 1st St Lincoln, NE | 3.0 | 2.0 | 1152 | $1,349 | $1.17 | 46d | 3 | 0.79mi |
| 1151 Elba Ave Lincoln, NE | 3.0 | 1.5 | 1443 | $1,695 | $1.17 | 46d | 1 | 0.87mi |
| 2636 N 4th St Unit 2636 Lincoln, NE | 3.0 | 2.0 | 1060 | $1,595 | $1.50 | 46d | 1 | 0.93mi |
| 2635 N 5th St Unit 2635 Lincoln, NE | 3.0 | 2.0 | 1060 | $1,595 | $1.50 | 46d | 1 | 0.94mi |
| 5265 NW 12th St Lincoln, NE | 2.0 | 1.0–2.0 | 932 | $1,895 | $2.03 | 16d | 15 | 1.16mi |
| 1632 Dodge St Lincoln, NE | 3.0 | 3.0 | 1958 | $2,000 | $1.02 | 23d | 1 | 1.26mi |
| 1431 Hilltop Rd Lincoln, NE | 2.0–3.0 | 2.0 | 1050 | $1,225 | $1.17 | 16d | 1 | 1.28mi |
| 4800 N 15th St Unit 4-LL07 Lincoln, NE | 3.0 | 2.0 | 1150 | $1,395 | $1.21 | 23d | 1 | 1.29mi |
| 4800 N 15th St Unit 4-303 Lincoln, NE | 3.0 | 2.0 | 1150 | $1,395 | $1.21 | 46d | 1 | 1.29mi |
| 1615 Old Glory Rd Lincoln, NE | 3.0 | 2.5 | 1564 | $1,800 | $1.15 | 46d | 1 | 1.35mi |
| 6157 NW 2nd Cir Lincoln, NE | 3.0 | 1.0–2.0 | 905 | $1,444 | $1.60 | 16d | 30 | 1.40mi |
Listing history 10 events
-
2026-04-07status Pending
-
2026-03-27$235,000 New
-
2026-02-08status Pending
-
2026-02-08historical
-
2025-12-24$220,000 New
-
2025-12-24historical
-
2025-08-01$250,000 New
-
2005-09-07soldstatus $128,355
-
2004-06-16soldstatus $120,000
-
2003-07-16soldstatus $116,000
ⓘ Source: listings_history table (triggers on properties + properties_extension) + one-shot
backfill from property_details.listing_events for pre-trigger history.
Tax reassessment forecast NE · Resets to sale price
- Current annual tax
- $2,805 · $234/mo
- Projected year-2 tax
- $4,066 · $339/mo
- Expected delta
- +$1,260/yr (+$105/mo · 44.9%)
ⓘ Screening estimate from a state-policy table — verify with the county assessor before closing.
Climate risk First Street
- Flood 6/10 Major FEMA zone X (unshaded) · 72% chance over 30 yrs
- Wildfire 1/10 Low
- Heat 3/10 Moderate 7 d/yr ≥105°F today · 16 d/yr by 30 yrs out
- Wind 2/10 Low
- Air quality 1/10 Low 0 unhealthy d/yr today · 0 by 30 yrs out
Nearby sold comps map
Loading sold comps map…
Walkable amenities ~0.75 mi
Loading nearby amenities…
Taxation est. · year 1
- Rental income
- $18,966
- − Mortgage interest
- −$13,164
- − Property taxes
- −$2,805
- − Insurance
- −$1,175
- − Repairs & maintenance
- −$1,517
- − Management
- −$1,517
- − Depreciation
- −$6,836
- Taxable loss
- −$8,048
- Est. tax savings @ 24.0%
- +$1,932
- After-tax cash flow
- $-1,853/yr
For passive investors: Depreciation is non-cash, so a rental often shows a tax loss while cash-flowing — sheltering income. Rental losses are passive: they offset passive income freely, and up to $25,000/yr can offset ordinary (W-2) income if you actively participate and your MAGI is under $100k (phasing out to $0 by $150k); unused losses carry forward. On sale, claimed depreciation is recaptured at up to 25%, and gains may owe capital-gains tax (a 1031 exchange can defer both). Figures are a year-1 estimate at your 24.0% rate — not tax advice; consult a CPA.
Schools (NCES district)
- District
- Lincoln Public Schools
- NCES district ID
- 3172840
- Math proficiency
- 50% ▼ -6.00%
- Reading proficiency
- 53% ▼ -3.00%
- Median HH income
- $50,273
- Composite
- 44.05/100
- National rank
- #2880
- State rank
- #59 of 111 in NE
Livability — Lincoln
- Score
- 85/100
- State rank
- #5
- US rank
- #545
Category grades
Schools grade is shown separately in the Schools card above.
Census & demographics
- Census place
- Lincoln, NE
- County
- Lancaster County · 291,509 people
- City population
- 291,509
- Metro
- Lincoln, NE
- Population (ZIP)
- 37,050
- Household income
- $67,483
- Rent vs Own
- Severe rent burden
- 1500.0
Population outlook (Lancaster County) Hauer SSP2
- Today (2025)
- 352,806 people
- By 2030
- 377,899 · +7.1%
- By 2040
- 428,582 · +21.5%
- By 2050
- 483,103 · +36.9%
- By 2075
- 632,390 · +79.2%
- By 2100
- 759,513 · +115.3%
Race, ethnicity, and origin ACS 2023
- Neighborhood character
- Predominantly White (70%)
- Race & ethnicity
- White 70% Hispanic / Latino 12% Asian 8% Two or more races 7% Black 5%
- Hispanic origin (detail)
- Mexican 7%
- Common ancestry
- Romanian 2% Arab 2% Italian 2%
- Foreign-born
- 15% · Vietnam, Canada, United Kingdom
- Languages at home
- 78% English-only · Spanish 9% Vietnamese 6% Arabic 3%
Political lean MEDSL · Lancaster
- 2024 margin
- Toss-up / Even · D 51.4% · R 47.1% · Other 1.5%
- 2008→2024 swing
- -0.7pp no change · 2008: 5.0pp · 2024: 4.3pp
- All cycles
- 2024: D+4.3 2020: D+7.8 2016: D+0.1 2012: R+1.0 2008: D+5.0
Not yet ingested
- Civics
- —
Market trends
- HPI YoY
- ▼ -124.30%
- Current HPI
- 239.8394
- Rent YoY
- ▲ 4.04%
- Metro
- Lincoln, NE
- State GDP YoY
- ▲ 0.68%
- F500 in state
- 2
Industry mix (Fortune 500 HQ in NE)
| Industry | F500 HQs | Revenue |
|---|---|---|
| Conglomerate | 1 | $371B |
|
||
Price history
+102.6% since first listed10 events — show timeline
- 2026-04-07 Pending — GPRMLS
- 2026-03-27 Listed $235,000 GPRMLS
- 2026-02-08 Pending — GPRMLS
- 2026-02-08 Listing Removed — GPRMLS
- 2025-12-24 Listing Removed — GPRMLS
- 2025-12-24 Listed $220,000 GPRMLS
- 2025-08-01 Listed $250,000 GPRMLS
- 2005-09-07 Sold (Public Records) $128,355 Public Records
- 2004-06-16 Sold (Public Records) $120,000 Public Records
- 2003-07-16 Sold (Public Records) $116,000 Public Records
Property tax history
+1.8%/yrLatest (2025): $2,805 · +7.8% YoY. Source: county tax records.
Cash-flow waterfall
monthlySold comps — $/sqft
last 12 mo · ≤1 miLoading sold comps…