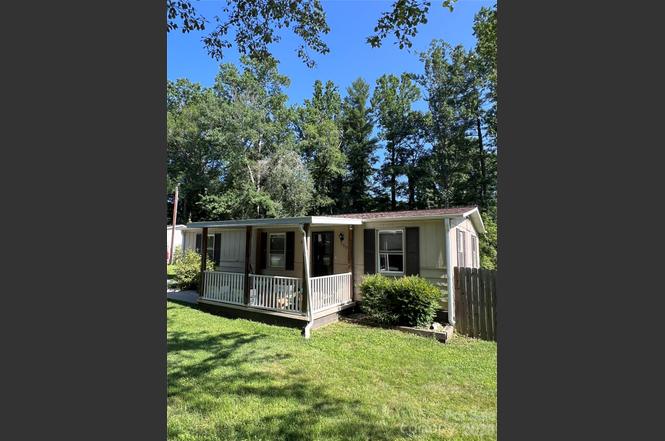
150 Piney Ridge Dr
Mountain Home, NC 28791
$100,000B-
3 bd · 1.5 ba ·
960 sqft ·
Built 1980
· Manufactured
· Active
· 111 DOM
Cashflow @ list (25.0% down · 7.5%)
Estimated rent
$2,299/mo
Mortgage (P&I)
−$524
Tax + insurance
−$94
HOA
−$0
Vac / Maint / Mgmt
−$483
Net cashflow
$1,198/mo
Annual
$14,376/yr
Cap rate
20.67%
Cash-on-cash
51.34%
DSCR
3.28
1% rule
2.30%
Cash to close
$28,000
Investor read
- This is a 3-bed/1.5-bath manufactured listed at $100k.
- At list price, monthly cash flow is $1k ($14k/yr) — positive.
- The deal already cash-flows at list — no discount required.
- Meets the 1% rule at list price ($2k rent vs $100k).
- It's been on market 111 days — a 9% lower offer ($91k) is reasonable based on typical stale-listing flexibility.
- Recommended offer: $91k (9.0% below list) — sets the bar for market timing.
- Local home prices are declining (-3.0%/yr); year-one equity from $691 of loan paydown is wiped out by about $3k of value loss. Plan a longer hold.
- Location reads 59/100 on livability (#550 in NC) — a working-class tenant base; expect higher turnover. Strengths: cost of living A, housing A, crime B+; Watch: employment C-, amenities F, commute F.
- Henderson County Schools (suburban): math 48% / reading 52% proficiency, ranked #64 of 178 in NC (top 36%) — acceptable for families but not a draw, mixed tenant base, ~2y average lease.
- Zoned schools: Mills River Elementary (math 66% / reading 60%, grade B, #168 of 1,410 statewide, top 12%, 589 students, 36% FRL); West Henderson High (math 73% / reading 63%, grade B, #137 of 535 statewide, top 26%, 1,087 students, 34% FRL).
- Zoned-school proficiency averages 66% at this address vs 50% district-wide (+16 pts) — the actual schools serving this property are materially stronger than the Henderson County Schools average implies; a family-tenant draw the district grade alone would hide.
- Market conditions: 149 active listings in the ZIP; solid renter incomes; 1,534 units permitted in Henderson County in 2024 (558 in 5+ unit buildings).
- Henderson County population projected at +20% by 2050 — long-run rental-demand tailwind backs the buy-and-hold thesis.
- 2 sale attempts with the ask held roughly flat each time — persistent listings suggest the price (not the market) is what's stuck; bring a comps-based counter.
- At projected returns (-3.0% appreciation + 3.0% rent growth), your $28k cash investment doubles in ~3 years — after that, you're playing with house money.
- Cap rate 20.7% vs local median 2.7% in Mountain Home — top-decile yield for the area; either an underpriced asset or a hidden risk that comps aren't pricing in. Stress-test before assuming the spread holds.
- This rent runs 35% of the median local income ($79k/yr) — at the standard rent-burdened threshold; future hikes will face affordability resistance.
Questions for listing agent
- It's been on market 111 days. Have you received any prior offers? Is the seller open to a 9% concession, seller financing, or rate buy-down credit?
- Why hasn't it sold? Are there any deal-killer items the seller is aware of (foundation, flood, title, zoning, code violations)?
- Is there a deadline driving the sale (1031 exchange, divorce, estate, relocation)? That informs how much negotiation room exists.
- Schools are F-rated, which usually means shorter tenancies and higher turnover. Who's the typical renter profile here, and what's been the actual vacancy rate?
- What's the average days-on-market for RENTAL listings here right now (not sales)? A rising rental-DOM trend means longer vacancies and softer asking-rent achievability than the comps imply.
- What's the recent tenant-quality profile in this submarket — average credit score on applications, eviction rate, late-payment / NSF rate, and stable-employment percentage? A property-management company in the area should have these aggregated.
- How much new for-sale + rental construction is in the pipeline within 1–3 miles? Heavy new supply typically softens prices + rents 12–24 months out; constrained supply supports both.
CashFlowRE · CFR-A5GX469BA3VCFX
· Data 2 days ago
cashflowre.app · 2026-05-29