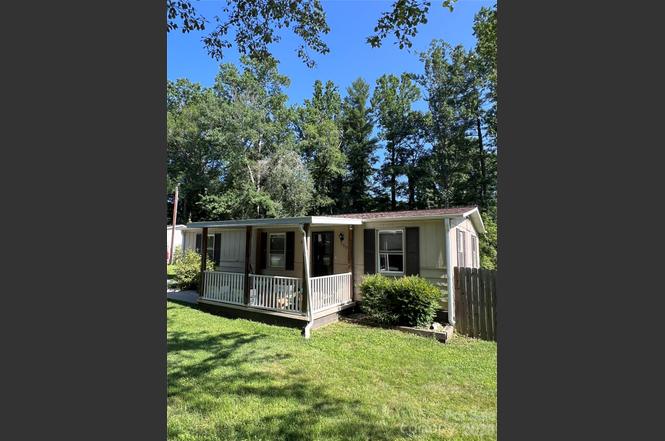
150 Piney Ridge Dr · Mountain Home, NC
Flood risk 3/10 · Minor
- FEMA flood zone
- X (unshaded)
- Chance of flooding over 30 yrs
- 0.2%
- Est. flood insurance / yr
- $507 – $1,088
Fire risk 3/10 · Minor
- Est. fire insurance / yr
- $906 – $1,684
Heat risk 4/10 · Minor
- Hot days now (above 97°F)
- 7 days/yr
- Hot days in 30 yrs
- 18 days/yr
Wind risk 2/10 · Minimal
- Chance of severe wind over 30 yrs
- —
Air-quality risk 3/10 · Minor
- Unhealthy air days now
- 2 days/yr
- Unhealthy air days in 30 yrs
- 3 days/yr
Risk factors via First Street. Map © Google.
Why this score? — see what drove the B- grade
The composite is a weighted blend of 9 inputs, each scored 0–100. Each bar is that input's sub-score; the figure is the points it added to the 100-point composite (weight × sub-score).
- Cash flow +30.0/30.0
- 1% rule +10.0/10.0
- DSCR +10.0/10.0
- ARV discount +7.5/15.0
- Schools +4.2/10.0
- Livability +3.0/5.0
- Rent growth +2.5/5.0
- Condition / age +2.5/5.0
- Appreciation +0.0/10.0
$100,000
🖨 Deal sheet 📄 Offer letter ✓ Due diligence
Listing remarks
Three-bedroom, one bathroom manufactured home on a level lot with front porch and back deck. Outbuilding and fenced backyard. Home needs TLC. IMPORTANT: Home does not have a working septic system and a typical septic system CANNOT be constructed on this property. New owner must use another approved way to handle onsite sewage. Cash purchase. Property sold "as-is" in current condition. No repairs, warranties, or inspections provided by seller. All offers subject to lien holder(s) approval. Buyer proof of funds or pre-qual letter and Short Sale Addendum to contract is required.
Key facts
- 0.35 acre lot
- Built 1980
- Listed 111 days
Property features AI
Finance
- Other: No representation restrictions noted
- HOA & community: No HOA; No community amenities listed
Exterior
- Parking: Driveway parking (no main-level garage)
- Utilities: City water; Septic needed (other sewer notes); Other utilities (see remarks)
- Home design: Manufactured doublewide single-family residence; One story; R2R zoning
- Construction: Manufactured construction; Hardboard siding; Crawl space/pier foundation (permanent); Built as a manufactured home (doublewide)
- Exterior features: Level lot with creek/stream; Back yard fenced with chain link; Outbuilding on the property; Roads are gravel and paved; publicly maintained
Interior
- Kitchen: No kitchen appliances listed
- Bedrooms: 3 bedrooms on the main level
- Flooring: Carpet; Laminate; Linoleum
- Bathrooms: 1 full bathroom on the main level
- Heating & cooling: Heat pump for heating and cooling; Other heating/cooling features (see remarks)
- Interior features: 5 total rooms; No built-in appliances listed
- Laundry & utility: Washer hookup on the main level; Electric dryer hookup
Neighborhood map
What this means for you Summary
Snapshot
- This is a 3-bed/1.5-bath manufactured listed at $100k.
Deal economics
- At list price, monthly cash flow is $1k ($14k/yr) — positive.
- The deal already cash-flows at list — no discount required.
- Meets the 1% rule at list price ($2k rent vs $100k).
- Recommended offer: $91k (9.0% below list) — sets the bar for market timing.
- Cap rate 20.7% vs local median 2.7% in Mountain Home — top-decile yield for the area; either an underpriced asset or a hidden risk that comps aren't pricing in. Stress-test before assuming the spread holds.
Location & tenants
- Location reads 59/100 on livability (#550 in NC) — a working-class tenant base; expect higher turnover. Strengths: cost of living A, housing A, crime B+; Watch: employment C-, amenities F, commute F.
- Henderson County Schools (suburban): math 48% / reading 52% proficiency, ranked #64 of 178 in NC (top 36%) — acceptable for families but not a draw, mixed tenant base, ~2y average lease.
- Zoned schools: Mills River Elementary (math 66% / reading 60%, grade B, #168 of 1,410 statewide, top 12%, 589 students, 36% FRL); West Henderson High (math 73% / reading 63%, grade B, #137 of 535 statewide, top 26%, 1,087 students, 34% FRL).
- Zoned-school proficiency averages 66% at this address vs 50% district-wide (+16 pts) — the actual schools serving this property are materially stronger than the Henderson County Schools average implies; a family-tenant draw the district grade alone would hide.
- Market conditions: 149 active listings in the ZIP; solid renter incomes; 1,534 units permitted in Henderson County in 2024 (558 in 5+ unit buildings).
- This rent runs 35% of the median local income ($79k/yr) — at the standard rent-burdened threshold; future hikes will face affordability resistance.
Forward outlook
- Local home prices are declining (-3.0%/yr); year-one equity from $691 of loan paydown is wiped out by about $3k of value loss. Plan a longer hold.
- Henderson County population projected at +20% by 2050 — long-run rental-demand tailwind backs the buy-and-hold thesis.
- At projected returns (-3.0% appreciation + 3.0% rent growth), your $28k cash investment doubles in ~3 years — after that, you're playing with house money.
Negotiation context
- It's been on market 111 days — a 9% lower offer ($91k) is reasonable based on typical stale-listing flexibility.
- 2 sale attempts with the ask held roughly flat each time — persistent listings suggest the price (not the market) is what's stuck; bring a comps-based counter.
Questions for the listing agent
- It's been on market 111 days. Have you received any prior offers? Is the seller open to a 9% concession, seller financing, or rate buy-down credit?
- Why hasn't it sold? Are there any deal-killer items the seller is aware of (foundation, flood, title, zoning, code violations)?
- Is there a deadline driving the sale (1031 exchange, divorce, estate, relocation)? That informs how much negotiation room exists.
- Schools are F-rated, which usually means shorter tenancies and higher turnover. Who's the typical renter profile here, and what's been the actual vacancy rate?
- What's the average days-on-market for RENTAL listings here right now (not sales)? A rising rental-DOM trend means longer vacancies and softer asking-rent achievability than the comps imply.
- What's the recent tenant-quality profile in this submarket — average credit score on applications, eviction rate, late-payment / NSF rate, and stable-employment percentage? A property-management company in the area should have these aggregated.
- How much new for-sale + rental construction is in the pipeline within 1–3 miles? Heavy new supply typically softens prices + rents 12–24 months out; constrained supply supports both.
Investment metrics
- 1% rule
- 2.30% ✓
- Cap rate
- 20.67%
- Cash-on-cash
- 51.34%
- DSCR
- 3.28
- GRM
- 3.6
CMA / ARV
No comps found within radius.
Projected returns pro-forma
-3.0% appreciation · 3.0% rent growth · sell at horizon
- IRR
- 49.2%
- Equity multiple
- 3.15×
- Total profit
- $60,087
- Equity at exit
- $14,910
- IRR
- 54.7%
- Equity multiple
- 6.38×
- Total profit
- $150,531
- Equity at exit
- $8,646
Cash invested: $28,000 (down + closing). Projections, not guarantees.
Landlord ↔ Tenant lean methodology
- Overall (STATE)
- 85 Strongly Landlord-Friendly
- State North Carolina
- 85 Strongly Landlord-Friendly · R+3
- County
- — inherits STATE
- City
- — inherits STATE
ZIP-level market 28791
- Active inventory
- 149
- Price-to-rent
- 3.6×
Monthly cashflow live
- Estimated rent
- $2,299 medium interval (Pro) →
- Mortgage (P&I)
- −$524
- Tax from tax record
- −$52 /mo · $626/yr
- Insurance
- −$42
- HOA
- −$0
- Vacancy / Maint / Mgmt
- −$483
- Net cashflow
- $1,198
Break-even live
UW: 25.0% down · 7.5% · 30yr · 1.5% tax · 5.0% vac · 8.0% maint · 8.0% mgmt
Financing live
Cash to close
- Down payment
- $25,000
- Closing costs
- $3,000
- Reserves months
- —
- Total cash needed
- —
Loan-product check · same deal, 3 products live
Conventional
25% down · 7.5% · 30yr
- Down + closing
- —
- Monthly P&I
- —
- Monthly cashflow
- —
- DSCR
- —
- Eligible?
- —
Personal DTI + credit; lowest rate.
DSCR
20% down · 8.5% · 30yr
- Down + closing
- —
- Monthly P&I
- —
- Monthly cashflow
- —
- DSCR
- —
- Eligible?
- —
No personal income docs; deal must DSCR.
Hard money
10% down · 12.0% · 12mo
- Down + closing
- —
- Monthly P&I
- —
- Monthly cashflow
- —
- DSCR
- —
- Eligible?
- —
Short-term bridge; refi at stabilization.
Listing history 20 events
-
2026-06-18days on market $100,000 Active 111 DOM
-
2026-06-17days on market $100,000 Active 110 DOM
-
2026-06-16days on market $100,000 Active 109 DOM
-
2026-06-15days on market $100,000 Active 108 DOM
-
2026-06-14days on market $100,000 Active 106 DOM
-
2026-06-13days on market $100,000 Active 105 DOM
-
2026-06-10days on market $100,000 Active 103 DOM
-
2026-06-09days on market $100,000 Active 102 DOM
-
2026-06-08days on market $100,000 Active 101 DOM
-
2026-06-07days on market $100,000 Active 100 DOM
-
2026-06-05days on market $100,000 Active 97 DOM
-
2026-06-03days on market $100,000 Active 96 DOM
-
2026-06-02days on market $100,000 Active 95 DOM
-
2026-06-01days on market $100,000 Active 94 DOM
-
2026-05-31days on market $100,000 Active 93 DOM
-
2026-05-30days on market $100,000 Active 92 DOM
-
2026-02-27$100,000 Active
-
2025-07-04$125,000 Active
-
2017-08-09soldstatus $92,000
-
2005-10-21soldstatus $68,000
ⓘ Source: listings_history table (triggers on properties + properties_extension) + one-shot
backfill from property_details.listing_events for pre-trigger history.
Tax reassessment forecast NC · Resets to sale price
- Current annual tax
- $626 · $52/mo
- Projected year-2 tax
- $820 · $68/mo
- Expected delta
- +$194/yr (+$16/mo · 31.0%)
ⓘ Screening estimate from a state-policy table — verify with the county assessor before closing.
Climate risk First Street
- Flood 3/10 Moderate FEMA zone X (unshaded) · 20% chance over 30 yrs
- Wildfire 3/10 Moderate
- Heat 4/10 Moderate 7 d/yr ≥97°F today · 18 d/yr by 30 yrs out
- Wind 2/10 Low
- Air quality 3/10 Moderate 2 unhealthy d/yr today · 3 by 30 yrs out
Nearby sold comps map
Loading sold comps map…
Walkable amenities ~0.75 mi
Loading nearby amenities…
Taxation est. · year 1
- Rental income
- $27,588
- − Mortgage interest
- −$5,602
- − Property taxes
- −$626
- − Insurance
- −$500
- − Repairs & maintenance
- −$2,207
- − Management
- −$2,207
- − Depreciation
- −$2,909
- Taxable income
- $13,538
- Est. tax owed @ 24.0%
- −$3,249
- After-tax cash flow
- $11,127/yr
For passive investors: Depreciation is non-cash, so a rental often shows a tax loss while cash-flowing — sheltering income. Rental losses are passive: they offset passive income freely, and up to $25,000/yr can offset ordinary (W-2) income if you actively participate and your MAGI is under $100k (phasing out to $0 by $150k); unused losses carry forward. On sale, claimed depreciation is recaptured at up to 25%, and gains may owe capital-gains tax (a 1031 exchange can defer both). Figures are a year-1 estimate at your 24.0% rate — not tax advice; consult a CPA.
Schools (NCES district)
- District
- Henderson County Schools
- NCES district ID
- 3702100
- Math proficiency
- 48% ▼ -2.00%
- Reading proficiency
- 52% ▼ -2.00%
- Median HH income
- $47,101
- Composite
- 42.5/100
- National rank
- #3206
- State rank
- #64 of 178 in NC
Livability — Mountain Home
- Score
- 59/100
- State rank
- #550
- US rank
- #20251
Category grades
Schools grade is shown separately in the Schools card above.
Census & demographics
- Census place
- Mountain Home, NC
- County
- Henderson County · 78,587 people
- City population
- 43
- Metro
- Asheville, NC
- Population (ZIP)
- 15,108
- Household income
- $78,827
- Rent vs Own
- Severe rent burden
- 253.0
Population outlook (Henderson County) Hauer SSP2
- Today (2025)
- 124,075 people
- By 2030
- 129,690 · +4.5%
- By 2040
- 139,898 · +12.8%
- By 2050
- 148,298 · +19.5%
- By 2075
- 163,980 · +32.2%
- By 2100
- 166,962 · +34.6%
Race, ethnicity, and origin ACS 2023
- Neighborhood character
- Predominantly White (83%)
- Race & ethnicity
- White 83% Hispanic / Latino 10% Two or more races 6% Asian 2% Black 2%
- Hispanic origin (detail)
- Mexican 6%
- Common ancestry
- Romanian 4% Slovak 3% Serbian 3%
- Foreign-born
- 8% · Canada, Jamaica
- Languages at home
- 92% English-only · Spanish 5% Other Asian/Pacific 1% German/W. Germanic 1%
Political lean MEDSL · Henderson
- 2024 margin
- R (+14.6) · D 42.1% · R 56.7% · Other 1.1%
- 2008→2024 swing
- +6.5pp toward D · 2008: -21.0pp · 2024: -14.6pp
- All cycles
- 2024: R+14.6 2020: R+18.8 2016: R+27.9 2012: R+27.6 2008: R+21.0
Not yet ingested
- Civics
- —
Market trends
- HPI YoY
- ▼ -160.98%
- Current HPI
- 207.4921
- Rent YoY
- —
- Metro
- Asheville, NC
- State GDP YoY
- ▲ 3.28%
- F500 in state
- 26
Industry mix (Fortune 500 HQ in NC)
| Industry | F500 HQs | Revenue |
|---|---|---|
| Financial Services | 2 | $213B |
|
||
| Retail | 2 | $95B |
|
||
| Industrial Conglomerate | 1 | $38B |
|
||
| Metals / Steel | 1 | $35B |
|
||
| Utilities | 1 | $30B |
|
||
| Industrial Machinery | 1 | $19B |
|
||
Price history
+47.1% since first listed4 events — show timeline
- 2026-02-27 Listed $100,000 CANOPYMLS as Distributed by MLS Grid
- 2025-07-04 Listed $125,000 CANOPYMLS as Distributed by MLS Grid
- 2017-08-09 Sold (Public Records) $92,000 Public Records
- 2005-10-21 Sold (Public Records) $68,000 Public Records
Property tax history
+4.7%/yrLatest (2025): $626 · +0.0% YoY. Source: county tax records.
Cash-flow waterfall
monthlySold comps — $/sqft
last 12 mo · ≤1 miLoading sold comps…