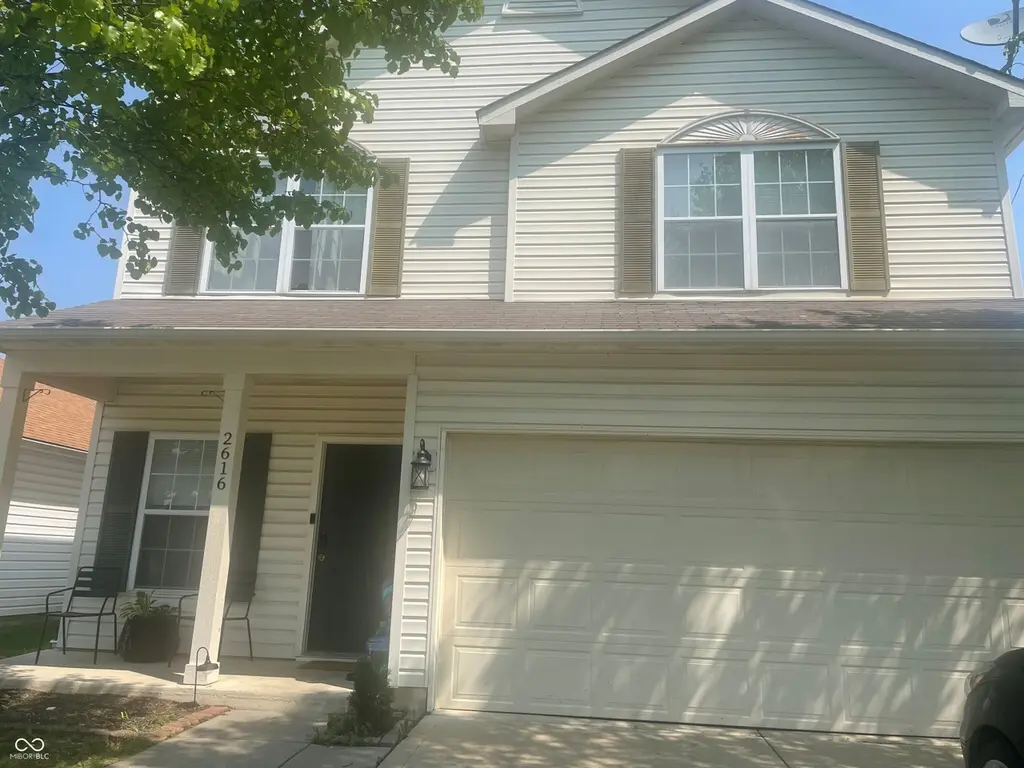
2616 Mingo Ln
Indianapolis city (balance), IN 46217
$150,000B
3 bd · 1.5 ba ·
1,992 sqft ·
Built 2003
· SingleFamily
· Pending
Cashflow @ list (25.0% down · 7.5%)
Estimated rent
$1,951/mo
Mortgage (P&I)
−$787
Tax + insurance
−$239
HOA
−$100
Vac / Maint / Mgmt
−$410
Net cashflow
$416/mo
Annual
$4,992/yr
Cap rate
9.62%
Cash-on-cash
11.89%
DSCR
1.53
1% rule
1.30%
Cash to close
$42,000
Investor read
- This is a 3-bed/1.5-bath single-family listed at $150k.
- At list price, monthly cash flow is $416 ($5k/yr) — positive.
- The deal already cash-flows at list — no discount required.
- Meets the 1% rule at list price ($2k rent vs $150k).
- Only 0 days on market — expect competitive offers; lowballing is unlikely to land.
- Local home prices are declining (-3.0%/yr); year-one equity from $1k of loan paydown is wiped out by about $4k of value loss. Plan a longer hold.
- Location reads: area grade B — affects rentability + tenant quality, not the cash-flow math above.
- Perry Township Schools (urban): math 36% / reading 45% proficiency, ranked #138 of 301 in IN (top 46%) — families likely to look elsewhere, expect single-tenant / working-renter base with shorter leases.
- Zoned schools: Glenns Valley Elementary School (math 53% / reading 41%, grade D-, #325 of 994 statewide, top 36%, 726 students, 70% FRL); Perry Meridian High School (math 34% / reading 64%, grade D, #136 of 369 statewide, top 37%, 2,350 students, 58% FRL).
- Market conditions: Rents rising (+3.5%/yr); 210 active listings in the ZIP; 7 comparable units currently listed for rent nearby; rentals leasing fast (median 4d on market — plan ~1-2 weeks tenant-placement turnaround); solid renter incomes; 1,906 units permitted in Marion County in 2024 (621 in 5+ unit buildings).
- Marion County population projected at +18% by 2050 — long-run rental-demand tailwind backs the buy-and-hold thesis.
- 2 sale attempts since 23y ago with the ask held roughly flat each time — persistent listings suggest the price (not the market) is what's stuck; bring a comps-based counter.
- Current owner paid $127k; 18% above their basis — modest negotiation headroom, anchor on the comps not their cost.
- At projected returns (-3.0% appreciation + 3.5% rent growth), your $42k cash investment doubles in ~9 years — after that, you're playing with house money.
- Cap rate 9.6% vs local median 4.4% in Indianapolis city (balance) — top-decile yield for the area; either an underpriced asset or a hidden risk that comps aren't pricing in. Stress-test before assuming the spread holds.
Questions for listing agent
- What does the HOA fee cover, when was the last increase, and are there any pending special assessments or reserve-fund shortfalls?
- Is there a deadline driving the sale (1031 exchange, divorce, estate, relocation)? That informs how much negotiation room exists.
- What's the average days-on-market for RENTAL listings here right now (not sales)? A rising rental-DOM trend means longer vacancies and softer asking-rent achievability than the comps imply.
- What's the recent tenant-quality profile in this submarket — average credit score on applications, eviction rate, late-payment / NSF rate, and stable-employment percentage? A property-management company in the area should have these aggregated.
- How much new for-sale + rental construction is in the pipeline within 1–3 miles? Heavy new supply typically softens prices + rents 12–24 months out; constrained supply supports both.
CashFlowRE · CFR-A5QJKH8VBXS7N7
· Data 3 weeks ago
cashflowre.app · 2026-05-29