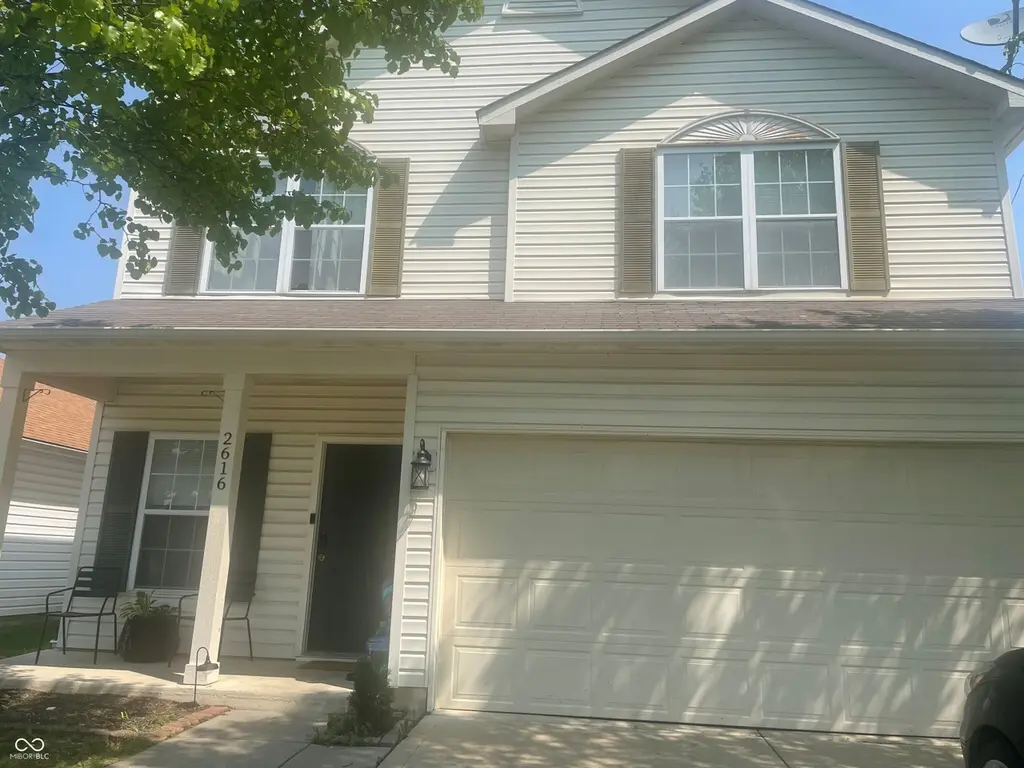
2616 Mingo Ln · Indianapolis city (balance), IN
Flood risk 1/10 · Minimal
- FEMA flood zone
- X (shaded)
- Chance of flooding over 30 yrs
- 0.0%
- Est. flood insurance / yr
- $507 – $1,088
Fire risk 1/10 · Minimal
- Est. fire insurance / yr
- $717 – $1,331
Heat risk 4/10 · Minor
- Hot days now (above 101°F)
- 7 days/yr
- Hot days in 30 yrs
- 19 days/yr
Wind risk 2/10 · Minimal
- Chance of severe wind over 30 yrs
- 1.0%
Air-quality risk 3/10 · Minor
- Unhealthy air days now
- 2 days/yr
- Unhealthy air days in 30 yrs
- 3 days/yr
Risk factors via First Street. Map © Google.
Why this score? — see what drove the B grade
The composite is a weighted blend of 9 inputs, each scored 0–100. Each bar is that input's sub-score; the figure is the points it added to the 100-point composite (weight × sub-score).
- Cash flow +26.9/30.0
- ARV discount +15.0/15.0
- DSCR +9.3/10.0
- 1% rule +8.0/10.0
- Schools +3.5/10.0
- Rent growth +3.4/5.0
- Livability +2.5/5.0
- Condition / age +2.5/5.0
- Appreciation +0.0/10.0
$150,000
🖨 Deal sheet 📄 Offer letter ✓ Due diligence
Listing remarks MLS
THERE'S ROOM FOR THE WHOLE FAMILY IN THIS SPACIOUS TWO STORY HOME. LARGE LIVING RM W/CERAMIC FIREPLACE & 2 SPOTLIGHTS, FR, 1ST FLR 1/2 BATH, LNDRY/UTILITY OFF KITCHEN, LOFT AREA W/WIC(CLD BE 4TH BR). ADDTNL WIC-BR 3. EXTRAS INCLDE 9' CLGS FIRST FLR, 2 CLG FAN R/IS, SLIDING DOOR OFF KTCHN. UPGRDE CRPT PAD, MBR W/GRDN TUB/SEP SHWR & WIC. UPGRDE KTCHN CBNTS, WNDW GRIDS ENTIRE HOME. CVRD FRNT PRCH, 2 CAR ATTCHD GARAGE W/GDO R/I & 2 R EMOTES.
Key facts
- 4,617 sq ft lot
- 2 garage spots
- Built 2003
Neighborhood map
What this means for you Summary
Snapshot
- This is a 3-bed/1.5-bath single-family listed at $150k.
Deal economics
- At list price, monthly cash flow is $416 ($5k/yr) — positive.
- The deal already cash-flows at list — no discount required.
- Meets the 1% rule at list price ($2k rent vs $150k).
- Cap rate 9.6% vs local median 4.4% in Indianapolis city (balance) — top-decile yield for the area; either an underpriced asset or a hidden risk that comps aren't pricing in. Stress-test before assuming the spread holds.
Location & tenants
- Location reads: area grade B — affects rentability + tenant quality, not the cash-flow math above.
- Perry Township Schools (urban): math 36% / reading 45% proficiency, ranked #138 of 301 in IN (top 46%) — families likely to look elsewhere, expect single-tenant / working-renter base with shorter leases.
- Zoned schools: Glenns Valley Elementary School (math 53% / reading 41%, grade D-, #325 of 994 statewide, top 36%, 726 students, 70% FRL); Perry Meridian High School (math 34% / reading 64%, grade D, #136 of 369 statewide, top 37%, 2,350 students, 58% FRL).
- Market conditions: Rents rising (+3.5%/yr); 210 active listings in the ZIP; 7 comparable units currently listed for rent nearby; rentals leasing fast (median 4d on market — plan ~1-2 weeks tenant-placement turnaround); solid renter incomes; 1,906 units permitted in Marion County in 2024 (621 in 5+ unit buildings).
Forward outlook
- Local home prices are declining (-3.0%/yr); year-one equity from $1k of loan paydown is wiped out by about $4k of value loss. Plan a longer hold.
- Marion County population projected at +18% by 2050 — long-run rental-demand tailwind backs the buy-and-hold thesis.
- At projected returns (-3.0% appreciation + 3.5% rent growth), your $42k cash investment doubles in ~9 years — after that, you're playing with house money.
Negotiation context
- Only 0 days on market — expect competitive offers; lowballing is unlikely to land.
- 2 sale attempts since 23y ago with the ask held roughly flat each time — persistent listings suggest the price (not the market) is what's stuck; bring a comps-based counter.
- Current owner paid $127k; 18% above their basis — modest negotiation headroom, anchor on the comps not their cost.
Questions for the listing agent
- What does the HOA fee cover, when was the last increase, and are there any pending special assessments or reserve-fund shortfalls?
- Is there a deadline driving the sale (1031 exchange, divorce, estate, relocation)? That informs how much negotiation room exists.
- What's the average days-on-market for RENTAL listings here right now (not sales)? A rising rental-DOM trend means longer vacancies and softer asking-rent achievability than the comps imply.
- What's the recent tenant-quality profile in this submarket — average credit score on applications, eviction rate, late-payment / NSF rate, and stable-employment percentage? A property-management company in the area should have these aggregated.
- How much new for-sale + rental construction is in the pipeline within 1–3 miles? Heavy new supply typically softens prices + rents 12–24 months out; constrained supply supports both.
Investment metrics
- 1% rule
- 1.30% ✓
- Cap rate
- 9.62%
- Cash-on-cash
- 11.89%
- DSCR
- 1.53
- GRM
- 6.4
CMA / ARV
- ARV (on-the-fly)
- $286,848
- Comps found
- 12
Show comp detail 12 sales within ~0.75 mi
| Address | Dist | Beds/Ba | Sqft | Sold | Price | $/sf | Match |
|---|---|---|---|---|---|---|---|
| 2616 Mingo Ln | 0.00mi | 3/2.5 | 1,992 (0%) | 0mo | $150,000 | $75 | 96 |
| 2603 Santaro Ct | 0.04mi | 4/2.5 (+1) | 2,027 (+2%) | 2mo | $298,000 | $147 | 84 |
| 7111 Allegan Dr | 0.37mi | 3/2.5 | 1,978 (-1%) | 4mo | $285,000 | $144 | 75 |
| 2501 Black Antler Ct | 0.57mi | 3/2.5 | 1,996 (+0%) | 5mo | $210,000 | $105 | 65 |
| 7305 Wellwood Dr | 0.18mi | 4/2.5 (+1) | 1,766 (-11%) | 4mo | $255,000 | $144 | 60 |
| 7033 Harness Lakes Dr | 0.25mi | 3/2.5 | 1,737 (-13%) | 4mo | $258,000 | $149 | 59 |
| 2911 Kaskaskia Way | 0.64mi | 3/2.0 | 1,896 (-5%) | 4mo | $323,500 | $171 | 57 |
| 2531 Redland Ln | 0.52mi | 3/2.5 | 1,824 (-8%) | 2mo | $239,900 | $132 | 56 |
| 2906 Shadow Lake Dr | 0.40mi | 4/2.5 (+1) | 1,824 (-8%) | 6mo | $295,000 | $162 | 53 |
| 7315 Pipestone Dr | 0.65mi | 3/2.5 | 2,180 (+9%) | 2mo | $300,000 | $138 | 48 |
| 7015 Blankenship Ave | 0.67mi | 3/2.5 | 1,782 (-10%) | 1mo | $255,000 | $143 | 46 |
| 7884 Sergi Canyon Dr | 0.74mi | 3/2.5 | 1,698 (-15%) | 3mo | $180,100 | $106 | 34 |
Match score weights: distance 35% · size 25% · config 20% · recency 20%. Top-matched comps best support the ARV.
Projected returns pro-forma
-3.0% appreciation · 3.46% rent growth · sell at horizon
- IRR
- 2.0%
- Equity multiple
- 1.08×
- Total profit
- $3,180
- Equity at exit
- $22,365
- IRR
- 12.1%
- Equity multiple
- 1.98×
- Total profit
- $40,984
- Equity at exit
- $12,969
Cash invested: $42,000 (down + closing). Projections, not guarantees.
Landlord ↔ Tenant lean methodology
- Overall (STATE)
- 90 Strongly Landlord-Friendly
- State Indiana
- 90 Strongly Landlord-Friendly · R+11
- County
- — inherits STATE
- City
- — inherits STATE
ZIP-level market 46217
- Rents YoY
- 3.5%
- Active inventory
- 210
- Price-to-rent
- 6.4×
Monthly cashflow live
- Estimated rent
- $1,951 high interval (Pro) →
- Mortgage (P&I)
- −$787
- Tax from tax record
- −$176 /mo · $2,113/yr
- Insurance
- −$62
- HOA
- −$100
- Vacancy / Maint / Mgmt
- −$410
- Net cashflow
- $416
Break-even live
UW: 25.0% down · 7.5% · 30yr · 1.5% tax · 5.0% vac · 8.0% maint · 8.0% mgmt
Financing live
Cash to close
- Down payment
- $37,500
- Closing costs
- $4,500
- Reserves months
- —
- Total cash needed
- —
Loan-product check · same deal, 3 products live
Conventional
25% down · 7.5% · 30yr
- Down + closing
- —
- Monthly P&I
- —
- Monthly cashflow
- —
- DSCR
- —
- Eligible?
- —
Personal DTI + credit; lowest rate.
DSCR
20% down · 8.5% · 30yr
- Down + closing
- —
- Monthly P&I
- —
- Monthly cashflow
- —
- DSCR
- —
- Eligible?
- —
No personal income docs; deal must DSCR.
Hard money
10% down · 12.0% · 12mo
- Down + closing
- —
- Monthly P&I
- —
- Monthly cashflow
- —
- DSCR
- —
- Eligible?
- —
Short-term bridge; refi at stabilization.
Rent comps 7 comps
| Address | Beds | Baths | Sqft | Rent | $/sqft | DOM | Units | Dist |
|---|---|---|---|---|---|---|---|---|
| 7150 Parklake Pl Indianapolis, IN | 3.0 | 2.0 | 1288 | $1,895 | $1.47 | 3d | 1 | 0.11mi |
| 2808 Dawnlake Dr Indianapolis, IN | 3.0 | 2.5 | 1481 | $1,750 | $1.18 | 3d | 1 | 0.20mi |
| 7247 Vista Cir Indianapolis, IN | 1.0–3.0 | 1.0–2.0 | 1086 | $2,111 | $1.94 | 2d | 25 | 0.35mi |
| 6744 Everbloom Ln Indianapolis, IN | 3.0 | 2.5 | 1568 | $1,931 | $1.23 | 24d | 1 | 0.39mi |
| 2729 Redland Ln Indianapolis, IN | 3.0 | 2.5 | 1757 | $1,829 | $1.04 | 3d | 1 | 0.57mi |
| 6666 Black Antler Dr Indianapolis, IN | 3.0 | 2.5 | 1998 | $1,900 | $0.95 | 15d | 1 | 0.62mi |
| 3753 Boundary Bay Dr Indianapolis, IN | 4.0 | 3.5 | 2446 | $2,526 | $1.03 | 4d | 1 | 1.10mi |
HOA detail
- Monthly dues
- $100 · $1,200/yr
Listing history 4 events
-
2026-04-29$150,000
-
2026-04-29historical
-
2003-07-10soldstatus $126,690 458-char remark
Show marketing remark (458 chars)
THERE'S ROOM FOR THE WHOLE FAMILY IN THIS SPACIOUS TWO STORY HOME. LARGE LIVING RM W/CERAMIC FIREPLACE & 2 SPOTLIGHTS, FR, 1ST FLR 1/2 BATH, LNDRY/UTILITY OFF KITCHEN, LOFT AREA W/WIC(CLD BE 4TH BR). ADDTNL WIC-BR 3. EXTRAS INCLDE 9' CLGS FIRST FLR, 2 CLG FAN R/IS, SLIDING DOOR OFF KTCHN. UPGRDE CRPT PAD, MBR W/GRDN TUB/SEP SHWR & WIC. UPGRDE KTCHN CBNTS, WNDW GRIDS ENTIRE HOME. CVRD FRNT PRCH, 2 CAR ATTCHD GARAGE W/GDO R/I & 2 R EMOTES.
-
2003-03-18$126,900 458-char remark
Show marketing remark (458 chars)
THERE'S ROOM FOR THE WHOLE FAMILY IN THIS SPACIOUS TWO STORY HOME. LARGE LIVING RM W/CERAMIC FIREPLACE & 2 SPOTLIGHTS, FR, 1ST FLR 1/2 BATH, LNDRY/UTILITY OFF KITCHEN, LOFT AREA W/WIC(CLD BE 4TH BR). ADDTNL WIC-BR 3. EXTRAS INCLDE 9' CLGS FIRST FLR, 2 CLG FAN R/IS, SLIDING DOOR OFF KTCHN. UPGRDE CRPT PAD, MBR W/GRDN TUB/SEP SHWR & WIC. UPGRDE KTCHN CBNTS, WNDW GRIDS ENTIRE HOME. CVRD FRNT PRCH, 2 CAR ATTCHD GARAGE W/GDO R/I & 2 R EMOTES.
ⓘ Source: listings_history table (triggers on properties + properties_extension) + one-shot
backfill from property_details.listing_events for pre-trigger history.
Tax reassessment forecast IN · Partial reset (capped growth)
- Current annual tax
- $2,113 · $176/mo
- Projected year-2 tax
- $2,113 · $176/mo
- Expected delta
- $0/yr ($0/mo · 0.0%)
ⓘ Screening estimate from a state-policy table — verify with the county assessor before closing.
Climate risk First Street
- Flood 1/10 Low FEMA zone X (shaded) · 0% chance over 30 yrs
- Wildfire 1/10 Low
- Heat 4/10 Moderate 7 d/yr ≥101°F today · 19 d/yr by 30 yrs out
- Wind 2/10 Low 100% chance of damaging wind over 30 yrs
- Air quality 3/10 Moderate 2 unhealthy d/yr today · 3 by 30 yrs out
Nearby sold comps map
Loading sold comps map…
Walkable amenities ~0.75 mi
Loading nearby amenities…
Taxation est. · year 1
- Rental income
- $23,410
- − Mortgage interest
- −$8,402
- − Property taxes
- −$2,113
- − Insurance
- −$750
- − Repairs & maintenance
- −$1,873
- − Management
- −$1,873
- − HOA
- −$1,200
- − Depreciation
- −$4,364
- Taxable income
- $2,836
- Est. tax owed @ 24.0%
- −$681
- After-tax cash flow
- $4,311/yr
For passive investors: Depreciation is non-cash, so a rental often shows a tax loss while cash-flowing — sheltering income. Rental losses are passive: they offset passive income freely, and up to $25,000/yr can offset ordinary (W-2) income if you actively participate and your MAGI is under $100k (phasing out to $0 by $150k); unused losses carry forward. On sale, claimed depreciation is recaptured at up to 25%, and gains may owe capital-gains tax (a 1031 exchange can defer both). Figures are a year-1 estimate at your 24.0% rate — not tax advice; consult a CPA.
Schools (NCES district)
- District
- Perry Township Schools
- NCES district ID
- 1808820
- Math proficiency
- 36% ▼ -13.00%
- Reading proficiency
- 45% ▼ -6.00%
- Median HH income
- $47,170
- Composite
- 34.61/100
- National rank
- #5153
- State rank
- #138 of 301 in IN
Livability — Indianapolis city (balance)
No livability data for this city. (Only ~50 U.S. cities are tracked.)
Census & demographics
- Census place
- Indianapolis city (balance), IN
- County
- Marion County · 998,460 people
- City population
- 881,119
- Metro
- Indianapolis-Carmel-Anderson, IN
- Population (ZIP)
- 36,917
- Household income
- $92,029
- Rent vs Own
- Severe rent burden
- 472.0
Population outlook (Marion County) Hauer SSP2
- Today (2025)
- 1,025,572 people
- By 2030
- 1,065,727 · +3.9%
- By 2040
- 1,141,577 · +11.3%
- By 2050
- 1,208,920 · +17.9%
- By 2075
- 1,367,288 · +33.3%
- By 2100
- 1,438,201 · +40.2%
Race, ethnicity, and origin ACS 2023
- Neighborhood character
- Diverse neighborhood (Simpson 0.60)
- Race & ethnicity
- White 59% Asian 20% Black 10% Hispanic / Latino 8% Two or more races 6%
- Hispanic origin (detail)
- Mexican 6%
- Common ancestry
- Lithuanian 3% Romanian 2% Iranian 1%
- Foreign-born
- 17% · Philippines, Canada, China
- Languages at home
- 76% English-only · Other Asian/Pacific 15% Spanish 6% Other Indo-European 1%
Political lean MEDSL · Marion
- 2024 margin
- Strong D (+27.7) · D 63.0% · R 35.3% · Other 1.7%
- 2008→2024 swing
- -0.7pp no change · 2008: 28.4pp · 2024: 27.7pp
- All cycles
- 2024: D+27.7 2020: D+29.1 2016: D+22.8 2012: D+22.2 2008: D+28.4
Not yet ingested
- Civics
- —
Market trends
- HPI YoY
- ▼ -221.18%
- Current HPI
- 223.147
- Rent YoY
- ▲ 3.46%
- Metro
- Indianapolis-Carmel-Anderson, IN
- State GDP YoY
- ▲ 2.90%
- F500 in state
- 18
Industry mix (Fortune 500 HQ in IN)
| Industry | F500 HQs | Revenue |
|---|---|---|
| Industrial Machinery | 2 | $37B |
|
||
| Healthcare | 1 | $177B |
|
||
| Pharmaceuticals | 1 | $45B |
|
||
| Metals / Steel | 1 | $18B |
|
||
| Agriculture | 1 | $17B |
|
||
| Packaging | 1 | $12B |
|
||
Price history
+18.2% since first listed4 events — show timeline
- 2026-04-29 Listed $150,000 MIBOR as Distributed by MLS Grid
- 2026-04-29 Listing Removed — MIBOR as Distributed by MLS Grid
- 2003-07-10 Sold (MLS) $126,690 MIBOR as Distributed by MLS Grid
- 2003-03-18 Listed $126,900 MIBOR as Distributed by MLS Grid
Property tax history
+5.0%/yrLatest (2025): $2,113 · -14.0% YoY. Source: county tax records.
Cash-flow waterfall
monthlySold comps — $/sqft
last 12 mo · ≤1 miLoading sold comps…