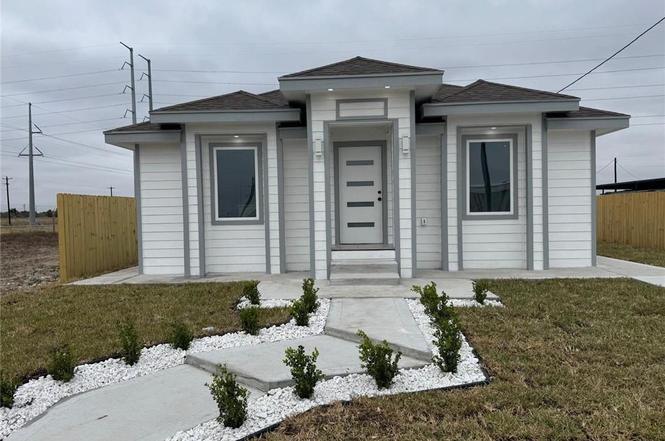
7513 Aztec St
Midway North, TX 78537
$179,999D-
3 bd · 2.0 ba ·
1,140 sqft ·
Built 2025
· SingleFamily
· Active
· 22 DOM
Cashflow @ list (25.0% down · 7.5%)
Estimated rent
$1,202/mo
Mortgage (P&I)
−$944
Tax + insurance
−$180
HOA
−$0
Vac / Maint / Mgmt
−$252
Net cashflow
$-175/mo
Annual
$-2,096/yr
Cap rate
5.13%
Cash-on-cash
-4.16%
DSCR
0.81
1% rule
0.67%
Cash to close
$50,400
Investor read
- This is a 3-bed/2.0-bath single-family listed at $180k.
- At list price, monthly cash flow is $-175 ($-2k/yr) — negative.
- To cash-flow at today's rent, offer at most $149k (17.1% below list).
- To meet the 1% rule (rent ≥ 1% of price), the offer needs to be $120k (33.2% below list).
- It's been on market 22 days — a 2% lower offer ($177k) is reasonable based on typical stale-listing flexibility.
- Recommended offer: $120k (33.2% below list) — sets the bar for 1% rule.
- In year one you build about $19k of equity ($1k loan paydown + $18k appreciation (10.0% local appreciation)).
- Location reads 56/100 on livability (#1,329 in TX) — a working-class tenant base; expect higher turnover. Strengths: cost of living A+, housing A+; Watch: amenities F, commute F, employment F.
- Donna ISD (suburban): math 11% / reading 18% proficiency, ranked #821 of 826 in TX (top 99%) — low school quality limits family demand, transient renter base, plan for 1-2y turnover.
- Zoned schools: C Stainke El (math 12% / reading 22%, grade F, #3,836 of 4,322 statewide, top 91%, 588 students, 96% FRL); Dora M Sauceda Middle (math 12% / reading 23%, grade F, #1,507 of 1,662 statewide, top 91%, 660 students, 100% FRL); Donna H S (math 16% / reading 21%, grade F, #1,436 of 1,632 statewide, top 88%, 2,095 students, 92% FRL) — zoned schools average 96% FRL vs 48% district-wide (48 pts higher); higher-poverty schools than district average — tighter screening recommended.
- Market conditions: 325 active listings in the ZIP; 7,378 units permitted in Hidalgo County in 2024 (641 in 5+ unit buildings).
- Hidalgo County population projected at +28% by 2050 — long-run rental-demand tailwind backs the buy-and-hold thesis.
- 3 sale attempts with the ask held roughly flat each time — persistent listings suggest the price (not the market) is what's stuck; bring a comps-based counter.
- By year 2, paydown + projected appreciation supports a ~$31k cash-out refi (75% LTV) — recoverable capital for the next deal without selling this one.
- Cap rate 5.1% vs local median 2.3% in Midway North — top-decile yield for the area; either an underpriced asset or a hidden risk that comps aren't pricing in. Stress-test before assuming the spread holds.
Questions for listing agent
- What do current leases actually rent for vs. the listed asking? Can we see a recent rent roll and the last 12 months of T-12 income?
- Is there a deadline driving the sale (1031 exchange, divorce, estate, relocation)? That informs how much negotiation room exists.
- Schools are F-rated, which usually means shorter tenancies and higher turnover. Who's the typical renter profile here, and what's been the actual vacancy rate?
- The area grade is low — what's the realistic commute time and amenity access for the typical tenant pool here? Any planned neighborhood developments (good or bad) we should know about?
- What's the average days-on-market for RENTAL listings here right now (not sales)? A rising rental-DOM trend means longer vacancies and softer asking-rent achievability than the comps imply.
- What's the recent tenant-quality profile in this submarket — average credit score on applications, eviction rate, late-payment / NSF rate, and stable-employment percentage? A property-management company in the area should have these aggregated.
- How much new for-sale + rental construction is in the pipeline within 1–3 miles? Heavy new supply typically softens prices + rents 12–24 months out; constrained supply supports both.
CashFlowRE · CFR-A6METB9EVWF8X9
· Data 1 h ago
cashflowre.app · 2026-05-29