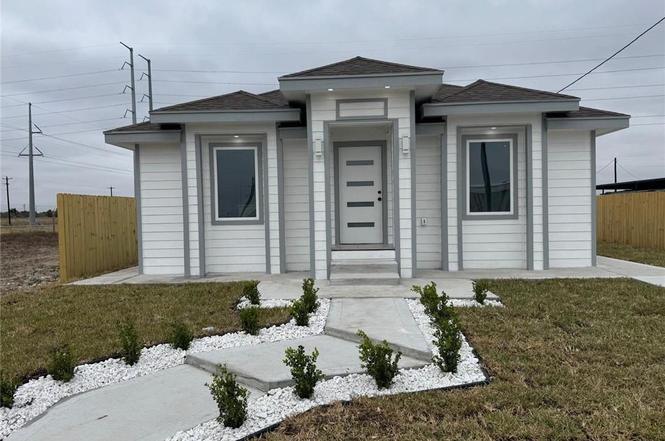
7513 Aztec St · Midway North, TX
Flood risk No data
- FEMA flood zone
- —
- Chance of flooding over 30 yrs
- —
- Est. flood insurance / yr
- —
Fire risk No data
- Est. fire insurance / yr
- —
Heat risk No data
- Hot days now (above threshold)
- —
- Hot days in 30 yrs
- —
Wind risk No data
- Chance of severe wind over 30 yrs
- —
Air-quality risk No data
- Unhealthy air days now
- —
- Unhealthy air days in 30 yrs
- —
Risk factors via First Street. Map © Google.
Why this score? — see what drove the D- grade
The composite is a weighted blend of 9 inputs, each scored 0–100. Each bar is that input's sub-score; the figure is the points it added to the 100-point composite (weight × sub-score).
- Appreciation +10.0/10.0
- Cash flow +8.1/30.0
- ARV discount +5.1/15.0
- Livability +2.8/5.0
- Rent growth +2.5/5.0
- Condition / age +2.5/5.0
- DSCR +2.1/10.0
- 1% rule +1.7/10.0
- Schools +1.1/10.0
$179,999
🖨 Deal sheet (PDF) 📄 Offer letter ✓ Due diligence
Listing remarks
Your search for the ideal rental property ends here! This prairie-style residence features three bedrooms equipped with recessed lighting and coffered ceilings. The home includes two bathrooms, each with a stall shower and attractive vanity. Additional highlights include wood-finished floors and a kitchen that boasts light stone countertops, white cabinetry, and a central island. The laundry area is designed with baseboards and connections for a washing machine and electric dryer. The expansive backyard offers ample space for family gatherings or future projects, along with a driveway. Please take advantage of this opportunity!
Key facts
- Coffered ceilings
- Central island
- Wood-finished floors
Tags
Property features AI
Finance
- HOA & community: No homeowners association
Exterior
- Parking: No garage
- Utilities: City sewer; Paved road access; Electric water heater
- Home design: Single-story residence
- Construction: HardiPlank and wood siding; Shingle roof; Slab foundation; Built on a 50 x 100 lot
- Exterior features: Sprinkler system; Other exterior features
Interior
- Kitchen: No conveying appliances; Electric water heater
- Bedrooms: Split bedrooms (separate bedroom areas)
- Flooring: Laminate flooring
- Bathrooms: 2 full bathrooms
- Heating & cooling: Central heating; Central air conditioning
- Interior features: Granite and solid surface countertops; Ceiling fans; Split-bedroom floor plan; Double-pane windows; No window coverings
- Laundry & utility: Dedicated laundry room with washer/dryer connections
Neighborhood map
What this means for you Summary
Snapshot
- This is a 3-bed/2.0-bath single-family listed at $180k.
Deal economics
- At list price, monthly cash flow is $-175 ($-2k/yr) — negative.
- To cash-flow at today's rent, offer at most $149k (17.1% below list).
- To meet the 1% rule (rent ≥ 1% of price), the offer needs to be $120k (33.2% below list).
- Recommended offer: $120k (33.2% below list) — sets the bar for 1% rule.
- Cap rate 5.1% vs local median 2.3% in Midway North — top-decile yield for the area; either an underpriced asset or a hidden risk that comps aren't pricing in. Stress-test before assuming the spread holds.
Location & tenants
- Location reads 56/100 on livability (#1,329 in TX) — a working-class tenant base; expect higher turnover. Strengths: cost of living A+, housing A+; Watch: amenities F, commute F, employment F.
- Donna ISD (suburban): math 11% / reading 18% proficiency, ranked #821 of 826 in TX (top 99%) — low school quality limits family demand, transient renter base, plan for 1-2y turnover.
- Zoned schools: C Stainke El (math 12% / reading 22%, grade F, #3,836 of 4,322 statewide, top 91%, 588 students, 96% FRL); Dora M Sauceda Middle (math 12% / reading 23%, grade F, #1,507 of 1,662 statewide, top 91%, 660 students, 100% FRL); Donna H S (math 16% / reading 21%, grade F, #1,436 of 1,632 statewide, top 88%, 2,095 students, 92% FRL) — zoned schools average 96% FRL vs 48% district-wide (48 pts higher); higher-poverty schools than district average — tighter screening recommended.
- Market conditions: 323 active listings in the ZIP; 7,378 units permitted in Hidalgo County in 2024 (641 in 5+ unit buildings).
Forward outlook
- In year one you build about $19k of equity ($1k loan paydown + $18k appreciation (10.0% local appreciation)).
- Hidalgo County population projected at +28% by 2050 — long-run rental-demand tailwind backs the buy-and-hold thesis.
- By year 2, paydown + projected appreciation supports a ~$31k cash-out refi (75% LTV) — recoverable capital for the next deal without selling this one.
Negotiation context
- It's been on market 19 days — a 2% lower offer ($177k) is reasonable based on typical stale-listing flexibility.
- 3 sale attempts with the ask held roughly flat each time — persistent listings suggest the price (not the market) is what's stuck; bring a comps-based counter.
Questions for the listing agent
- What do current leases actually rent for vs. the listed asking? Can we see a recent rent roll and the last 12 months of T-12 income?
- Is there a deadline driving the sale (1031 exchange, divorce, estate, relocation)? That informs how much negotiation room exists.
- Schools are F-rated, which usually means shorter tenancies and higher turnover. Who's the typical renter profile here, and what's been the actual vacancy rate?
- The area grade is low — what's the realistic commute time and amenity access for the typical tenant pool here? Any planned neighborhood developments (good or bad) we should know about?
- What's the average days-on-market for RENTAL listings here right now (not sales)? A rising rental-DOM trend means longer vacancies and softer asking-rent achievability than the comps imply.
- What's the recent tenant-quality profile in this submarket — average credit score on applications, eviction rate, late-payment / NSF rate, and stable-employment percentage? A property-management company in the area should have these aggregated.
- How much new for-sale + rental construction is in the pipeline within 1–3 miles? Heavy new supply typically softens prices + rents 12–24 months out; constrained supply supports both.
Investment metrics
- 1% rule
- 0.67% ✗
- Cap rate
- 5.13%
- Cash-on-cash
- -4.16%
- DSCR
- 0.81
- GRM
- 12.5
CMA / ARV
- ARV (on-the-fly)
- $171,000
- Comps found
- 2
Show comp detail 2 sales within ~0.75 mi
| Address | Dist | Beds/Ba | Sqft | Sold | Price | $/sf | Match |
|---|---|---|---|---|---|---|---|
| 7490 Aztec St | 0.03mi | 3/2.0 | 1,120 (-2%) | 7mo | $168,000 | $150 | 90 |
| 7210 Los Cielos Cir E | 0.37mi | 2/2.0 (-1) | 1,280 (+12%) | 22mo | $149,000 | $116 | 39 |
Match score weights: distance 35% · size 25% · config 20% · recency 20%. Top-matched comps best support the ARV.
Projected returns pro-forma
10.0% appreciation · 3.0% rent growth · sell at horizon
- IRR
- 21.3%
- Equity multiple
- 2.72×
- Total profit
- $86,850
- Equity at exit
- $162,157
- IRR
- 19.3%
- Equity multiple
- 6.25×
- Total profit
- $264,399
- Equity at exit
- $349,698
Cash invested: $50,400 (down + closing). Projections, not guarantees.
Landlord ↔ Tenant lean methodology
- Overall (STATE)
- 87 Strongly Landlord-Friendly
- State Texas
- 87 Strongly Landlord-Friendly · R+5
- County
- — inherits STATE
- City
- — inherits STATE
ZIP-level market 78537
- Home prices YoY
- 5.8%
- Active inventory
- 323
- Price-to-rent
- 12.5×
Monthly cashflow live
- Estimated rent
- $1,202 medium interval (Pro) →
- Mortgage (P&I)
- −$944
- Tax from tax record
- −$105 /mo · $1,265/yr
- Insurance
- −$75
- HOA
- −$0
- Vacancy / Maint / Mgmt
- −$252
- Net cashflow
- $-175
Break-even live
Sensitivity live
| Price | -10% $-73 | -5% $-124 | +0% $-175 | +5% $-226 | +10% $-277 |
|---|---|---|---|---|---|
| Rent | -10% $-270 | -5% $-222 | +0% $-175 | +5% $-127 | +10% $-80 |
| Rate | -1.0pp $-84 | -0.5pp $-129 | base $-175 | +0.5pp $-221 | +1.0pp $-269 |
UW: 25.0% down · 7.5% · 30yr · 1.5% tax · 5.0% vac · 8.0% maint · 8.0% mgmt
Financing live
Cash to close
- Down payment
- $45,000
- Closing costs
- $5,400
- Reserves months
- —
- Total cash needed
- —
Loan-product check · same deal, 3 products live
Conventional
25% down · 7.5% · 30yr
- Down + closing
- —
- Monthly P&I
- —
- Monthly cashflow
- —
- DSCR
- —
- Eligible?
- —
Personal DTI + credit; lowest rate.
DSCR
20% down · 8.5% · 30yr
- Down + closing
- —
- Monthly P&I
- —
- Monthly cashflow
- —
- DSCR
- —
- Eligible?
- —
No personal income docs; deal must DSCR.
Hard money
10% down · 12.0% · 12mo
- Down + closing
- —
- Monthly P&I
- —
- Monthly cashflow
- —
- DSCR
- —
- Eligible?
- —
Short-term bridge; refi at stabilization.
Listing history 16 events
-
2026-06-18days on market $179,999 Active 19 DOM
-
2026-06-17days on market $179,999 Active 18 DOM
-
2026-06-16days on market $179,999 Active 17 DOM
-
2026-06-15days on market $179,999 Active 16 DOM
-
2026-06-14days on market $179,999 Active 14 DOM
-
2026-06-13days on market $179,999 Active 13 DOM
-
2026-06-10days on market $179,999 Active 11 DOM
-
2026-06-09days on market $179,999 Active 10 DOM
-
2026-06-08days on market $179,999 Active 9 DOM
-
2026-06-07days on market $179,999 Active 8 DOM
-
2026-06-05days on market $179,999 Active 5 DOM
-
2026-06-03days on market $179,999 Active 4 DOM
-
2026-06-02days on market $179,999 Active 3 DOM
-
2026-06-01days on market $179,999 Active 2 DOM
-
2026-06-01remarks 635-char remark
-
2026-06-01$179,999 Active 1 DOM
ⓘ Source: listings_history table (triggers on properties + properties_extension) + one-shot
backfill from property_details.listing_events for pre-trigger history.
Tax reassessment forecast TX · Resets to sale price
- Current annual tax
- $1,265 · $105/mo
- Projected year-2 tax
- $3,294 · $274/mo
- Expected delta
- +$2,029/yr (+$169/mo · 160.5%)
ⓘ Screening estimate from a state-policy table — verify with the county assessor before closing.
Nearby sold comps map
Loading sold comps map…
Walkable amenities ~0.75 mi
Loading nearby amenities…
Taxation est. · year 1
- Rental income
- $14,424
- − Mortgage interest
- −$10,083
- − Property taxes
- −$1,265
- − Insurance
- −$900
- − Repairs & maintenance
- −$1,154
- − Management
- −$1,154
- − Depreciation
- −$5,236
- Taxable loss
- −$5,367
- Est. tax savings @ 24.0%
- +$1,288
- After-tax cash flow
- $-808/yr
For passive investors: Depreciation is non-cash, so a rental often shows a tax loss while cash-flowing — sheltering income. Rental losses are passive: they offset passive income freely, and up to $25,000/yr can offset ordinary (W-2) income if you actively participate and your MAGI is under $100k (phasing out to $0 by $150k); unused losses carry forward. On sale, claimed depreciation is recaptured at up to 25%, and gains may owe capital-gains tax (a 1031 exchange can defer both). Figures are a year-1 estimate at your 24.0% rate — not tax advice; consult a CPA.
Schools (NCES district)
- District
- Donna ISD
- NCES district ID
- 4817390
- Math proficiency
- 11% ▼ -30.00%
- Reading proficiency
- 18% ▼ -13.00%
- Median HH income
- $27,330
- Composite
- 11.16/100
- National rank
- #9728
- State rank
- #821 of 826 in TX
Livability — Midway North
- Score
- 56/100
- State rank
- #1329
- US rank
- #22888
Category grades
Schools grade is shown separately in the Schools card above.
Census & demographics
- Population (ZIP)
- 51,346
Population outlook (Hidalgo County) Hauer SSP2
- Today (2025)
- 955,232 people
- By 2030
- 1,009,774 · +5.7%
- By 2040
- 1,120,332 · +17.3%
- By 2050
- 1,225,036 · +28.2%
- By 2075
- 1,439,189 · +50.7%
- By 2100
- 1,533,429 · +60.5%
Race, ethnicity, and origin ACS 2023
- Neighborhood character
- Predominantly Hispanic (95%)
- Race & ethnicity
- Hispanic / Latino 95% Two or more races 49% White 4%
- Hispanic origin (detail)
- Mexican 91%
- Foreign-born
- 27% · Canada
- Languages at home
- 15% English-only · Spanish 84%
Political lean MEDSL · Hidalgo
- 2024 margin
- Toss-up / Even · D 48.1% · R 51.0%
- 2008→2024 swing
- -41.6pp toward R · 2008: 38.7pp · 2024: -2.9pp
- All cycles
- 2024: R+2.9 2020: D+17.1 2016: D+40.5 2012: D+41.8 2008: D+38.7
Not yet ingested
- Civics
- —
Market trends
- HPI YoY
- ▲ 13.30%
- Current HPI
- 243.3933
- Rent YoY
- —
- Metro
- —
- State GDP YoY
- ▲ 3.95%
- F500 in state
- 110
Industry mix (Fortune 500 HQ in TX)
| Industry | F500 HQs | Revenue |
|---|---|---|
| Energy | 16 | $1,198B |
|
||
| Technology | 5 | $198B |
|
||
| Engineering / Construction | 4 | $72B |
|
||
| Energy Services | 3 | $60B |
|
||
| Utilities | 3 | $41B |
|
||
| Healthcare | 2 | $330B |
|
||
Price history
-5.2% since first listed4 events — show timeline
- 2026-05-31 Relisted — MCALLENMLS
- 2026-05-31 Price Changed $179,999 MCALLENMLS
- 2026-03-10 Listed $184,900 MCALLENMLS
- 2025-02-25 Listed $189,900 MCALLENMLS
Property tax history
+145.1%/yrLatest (2025): $1,265 · +145.1% YoY. Source: county tax records.
Cash-flow waterfall
monthlySold comps — $/sqft
last 12 mo · ≤1 miLoading sold comps…