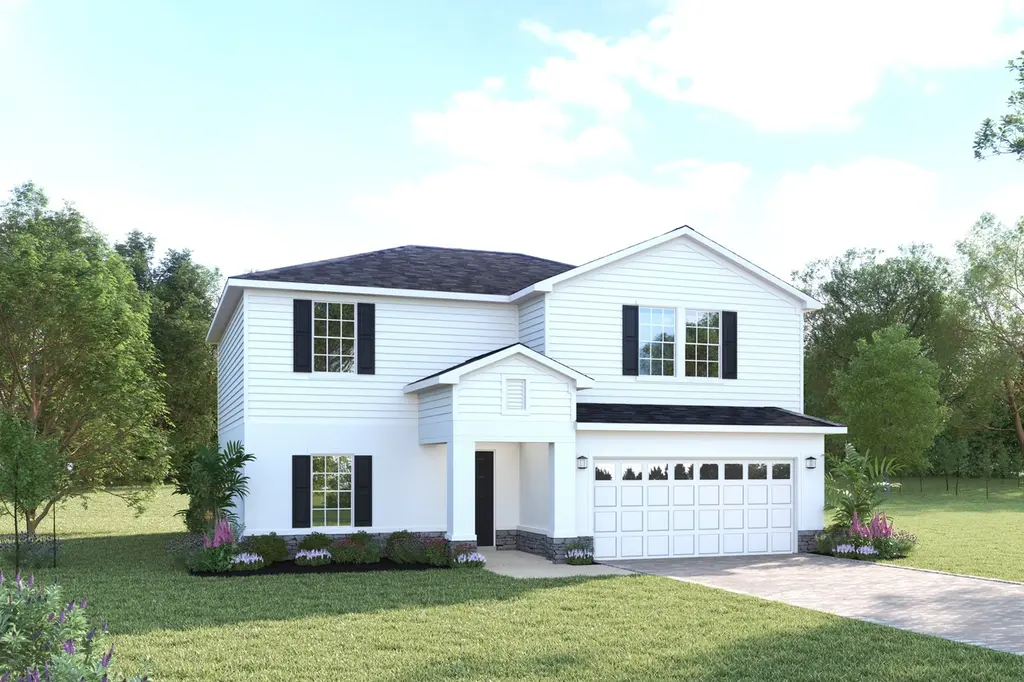
15622 Twilight St
Indiantown, FL 34956
$399,990D
4 bd · 2.5 ba ·
2,240 sqft ·
Built 2026
· SingleFamily
· Active
· 5 DOM
Cashflow @ list (25.0% down · 7.5%)
Estimated rent
$3,003/mo
Mortgage (P&I)
−$2,098
Tax + insurance
−$733
HOA
−$217
Vac / Maint / Mgmt
−$631
Net cashflow
$-675/mo
Annual
$-8,105/yr
Cap rate
4.47%
Cash-on-cash
-6.52%
DSCR
0.71
1% rule
0.75%
Cash to close
$111,997
Investor read
- This is a 4-bed/2.5-bath single-family listed at $400k.
- At list price, monthly cash flow is $-675 ($-8k/yr) — negative.
- To cash-flow at today's rent, offer at most $302k (24.4% below list).
- To meet the 1% rule (rent ≥ 1% of price), the offer needs to be $300k (24.9% below list).
- Only 5 days on market — expect competitive offers; lowballing is unlikely to land.
- Recommended offer: $300k (24.9% below list) — sets the bar for 1% rule.
- In year one you build about $29k of equity ($3k loan paydown + $27k appreciation (6.7% local appreciation)).
- Location reads 59/100 on livability (#829 in FL) — a working-class tenant base; expect higher turnover. Strengths: cost of living A+, housing A+; Watch: amenities F, commute F, employment F.
- Martin (suburban): math 52% / reading 53% proficiency, ranked #24 of 73 in FL (top 33%) — acceptable for families but not a draw, mixed tenant base, ~2y average lease.
- Zoned schools: Warfield Elementary School (math 22% / reading 19%, grade F, #2,094 of 2,144 statewide, top 98%, 686 students, 79% FRL); Indiantown Middle School (math 42% / reading 29%, grade F, #414 of 571 statewide, top 73%, 646 students, 75% FRL); South Fork High School (math 36% / reading 48%, grade F, #275 of 667 statewide, top 42%, 1,810 students, 51% FRL) — zoned schools average 68% FRL vs 41% district-wide (27 pts higher); higher-poverty schools than district average — tighter screening recommended.
- Zoned-school proficiency averages 33% at this address vs 52% district-wide (-20 pts) — the specific schools serving this property underperform the Martin average; the district grade overstates school quality for this exact location.
- Watch-outs: flood insurance adds $66/mo.
- Market conditions: 136 active listings in the ZIP; 4 comparable units currently listed for rent nearby; rentals at typical pace (median 16d on market — plan ~3-4 weeks tenant-placement turnaround); 737 units permitted in Martin County in 2024 (167 in 5+ unit buildings).
- Martin County population projected at +19% by 2050 — long-run rental-demand tailwind backs the buy-and-hold thesis.
- By year 2, paydown + projected appreciation supports a ~$47k cash-out refi (75% LTV) — recoverable capital for the next deal without selling this one.
- Climate carrying-cost: severe flood risk; severe wind risk, 99% chance of damaging wind over 30y; moderate wildfire risk; extreme-heat days projected 7→24/yr by 2055 (HVAC capex compounding) — expect insurance premiums to compound above CPI over the hold.
- Cap rate 4.5% vs local median 11.7% in Indiantown — below-typical yield; the buyer is paying a premium for something (appreciation thesis, condition, location) that the cap rate doesn't capture.
Questions for listing agent
- What do current leases actually rent for vs. the listed asking? Can we see a recent rent roll and the last 12 months of T-12 income?
- What's the actual annual flood-insurance premium (NFIP or private), and is the property in a SFHA with mandatory coverage?
- What does the HOA fee cover, when was the last increase, and are there any pending special assessments or reserve-fund shortfalls?
- Is there a deadline driving the sale (1031 exchange, divorce, estate, relocation)? That informs how much negotiation room exists.
- Schools are F-rated, which usually means shorter tenancies and higher turnover. Who's the typical renter profile here, and what's been the actual vacancy rate?
- The area grade is low — what's the realistic commute time and amenity access for the typical tenant pool here? Any planned neighborhood developments (good or bad) we should know about?
- What's the average days-on-market for RENTAL listings here right now (not sales)? A rising rental-DOM trend means longer vacancies and softer asking-rent achievability than the comps imply.
- What's the recent tenant-quality profile in this submarket — average credit score on applications, eviction rate, late-payment / NSF rate, and stable-employment percentage? A property-management company in the area should have these aggregated.
CashFlowRE · CFR-A8S1VN93FQC2ZY
· Data 19 h ago
cashflowre.app · 2026-05-29