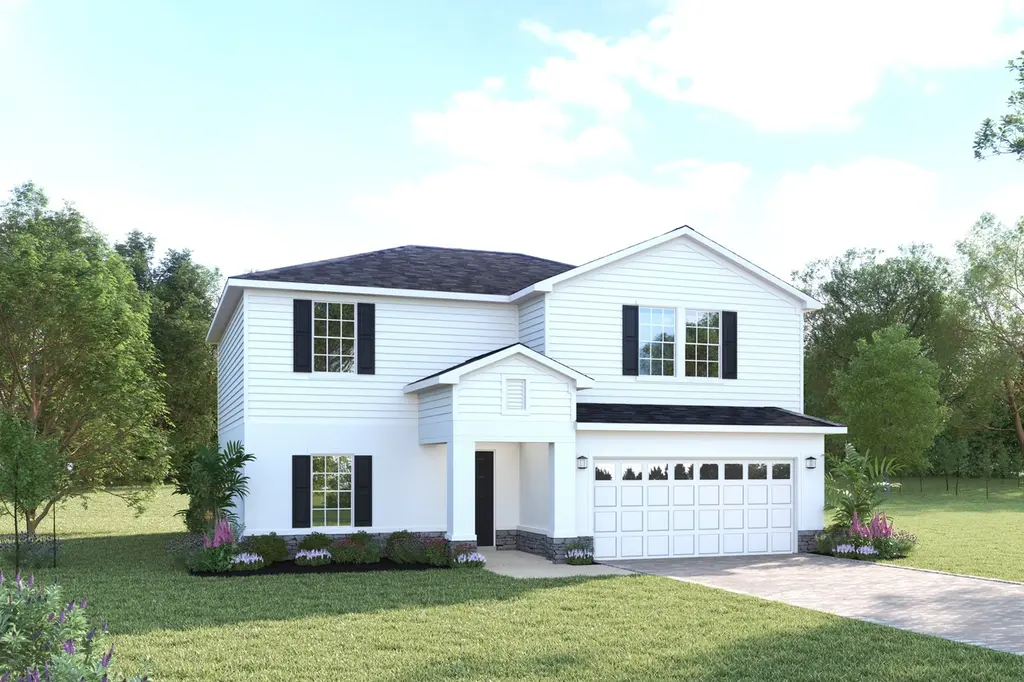
15622 Twilight St · Indiantown, FL
Flood risk 10/10 · Severe
- FEMA flood zone
- X (unshaded)
- Chance of flooding over 30 yrs
- 0.99%
- Est. flood insurance / yr
- $507 – $1,088
Fire risk 5/10 · Moderate
- Est. fire insurance / yr
- $947 – $1,759
Heat risk 9/10 · Severe
- Hot days now (above 108°F)
- 7 days/yr
- Hot days in 30 yrs
- 24 days/yr
Wind risk 10/10 · Severe
- Chance of severe wind over 30 yrs
- 99.0%
Air-quality risk 2/10 · Minimal
- Unhealthy air days now
- 0 days/yr
- Unhealthy air days in 30 yrs
- 1 days/yr
Risk factors via First Street. Map © Google.
Why this score? — see what drove the D grade
The composite is a weighted blend of 9 inputs, each scored 0–100. Each bar is that input's sub-score; the figure is the points it added to the 100-point composite (weight × sub-score).
- ARV discount +11.7/15.0
- Appreciation +8.3/10.0
- Cash flow +6.9/30.0
- Schools +4.5/10.0
- Livability +3.0/5.0
- 1% rule +2.5/10.0
- Rent growth +2.5/5.0
- Condition / age +2.5/5.0
- DSCR +1.1/10.0
$399,990
🖨 Deal sheet (PDF) 📄 Offer letter ✓ Due diligence
Listing remarks
The Willow single-family home has what you want. From the foyer or 2-car garage, enter to a wide-open floor plan. Versatile flex space in the front is perfect for a home office or homework station. It flows seamlessly into the great room where you can relax with loved ones before gathering round the large island, dining table or on the lanai for homemade meals fresh from the gourmet kitchen. Upstairs, watch a movie in the loft. Family and friends have their pick of 3 spacious bedrooms, while in your luxury owner's suite, you'll love the double vanity bath and walk-in closet. The Willow will wow you.
Key facts
- Flex space
- Loft
- Gourmet kitchen
Tags
Property features AI
Finance
- Other: Active listing (last modified 2026-06-16)
- Financial info: List price $399,990
- HOA & community: Association fee approximately $217 (periodicity not specified)
Exterior
- Parking: 2 parking spaces
- Utilities: Central air (electric)
- Home design: Spec home, Willow plan
- Exterior features: Address: 15622 Twilight St, Indiantown, FL 34956
Interior
- Bedrooms: 4 bedrooms
- Bathrooms: 2 full bathrooms; 1 half bathroom
- Heating & cooling: Central air conditioning
- Interior features: Open living areas (2240 total living area across the home)
Neighborhood map
What this means for you Summary
Snapshot
- This is a 4-bed/2.5-bath single-family listed at $400k.
Deal economics
- At list price, monthly cash flow is $-675 ($-8k/yr) — negative.
- To cash-flow at today's rent, offer at most $302k (24.4% below list).
- To meet the 1% rule (rent ≥ 1% of price), the offer needs to be $300k (24.9% below list).
- Recommended offer: $300k (24.9% below list) — sets the bar for 1% rule.
- Cap rate 4.5% vs local median 11.7% in Indiantown — below-typical yield; the buyer is paying a premium for something (appreciation thesis, condition, location) that the cap rate doesn't capture.
Location & tenants
- Location reads 59/100 on livability (#829 in FL) — a working-class tenant base; expect higher turnover. Strengths: cost of living A+, housing A+; Watch: amenities F, commute F, employment F.
- Martin (suburban): math 52% / reading 53% proficiency, ranked #24 of 73 in FL (top 33%) — acceptable for families but not a draw, mixed tenant base, ~2y average lease.
- Zoned schools: Warfield Elementary School (math 22% / reading 19%, grade F, #2,094 of 2,144 statewide, top 98%, 686 students, 79% FRL); Indiantown Middle School (math 42% / reading 29%, grade F, #414 of 571 statewide, top 73%, 646 students, 75% FRL); South Fork High School (math 36% / reading 48%, grade F, #275 of 667 statewide, top 42%, 1,810 students, 51% FRL) — zoned schools average 68% FRL vs 41% district-wide (27 pts higher); higher-poverty schools than district average — tighter screening recommended.
- Zoned-school proficiency averages 33% at this address vs 52% district-wide (-20 pts) — the specific schools serving this property underperform the Martin average; the district grade overstates school quality for this exact location.
- Market conditions: 136 active listings in the ZIP; 4 comparable units currently listed for rent nearby; rentals at typical pace (median 16d on market — plan ~3-4 weeks tenant-placement turnaround); 737 units permitted in Martin County in 2024 (167 in 5+ unit buildings).
Forward outlook
- In year one you build about $29k of equity ($3k loan paydown + $27k appreciation (6.7% local appreciation)).
- Martin County population projected at +19% by 2050 — long-run rental-demand tailwind backs the buy-and-hold thesis.
- By year 2, paydown + projected appreciation supports a ~$47k cash-out refi (75% LTV) — recoverable capital for the next deal without selling this one.
Negotiation context
- Only 5 days on market — expect competitive offers; lowballing is unlikely to land.
Risks & watch-outs
- Watch-outs: flood insurance adds $66/mo.
- Climate carrying-cost: severe flood risk; severe wind risk, 99% chance of damaging wind over 30y; moderate wildfire risk; extreme-heat days projected 7→24/yr by 2055 (HVAC capex compounding) — expect insurance premiums to compound above CPI over the hold.
Questions for the listing agent
- What do current leases actually rent for vs. the listed asking? Can we see a recent rent roll and the last 12 months of T-12 income?
- What's the actual annual flood-insurance premium (NFIP or private), and is the property in a SFHA with mandatory coverage?
- What does the HOA fee cover, when was the last increase, and are there any pending special assessments or reserve-fund shortfalls?
- Is there a deadline driving the sale (1031 exchange, divorce, estate, relocation)? That informs how much negotiation room exists.
- Schools are F-rated, which usually means shorter tenancies and higher turnover. Who's the typical renter profile here, and what's been the actual vacancy rate?
- The area grade is low — what's the realistic commute time and amenity access for the typical tenant pool here? Any planned neighborhood developments (good or bad) we should know about?
- What's the average days-on-market for RENTAL listings here right now (not sales)? A rising rental-DOM trend means longer vacancies and softer asking-rent achievability than the comps imply.
- What's the recent tenant-quality profile in this submarket — average credit score on applications, eviction rate, late-payment / NSF rate, and stable-employment percentage? A property-management company in the area should have these aggregated.
- How much new for-sale + rental construction is in the pipeline within 1–3 miles? Heavy new supply typically softens prices + rents 12–24 months out; constrained supply supports both.
Investment metrics
- 1% rule
- 0.75% ✗
- Cap rate
- 4.47%
- Cash-on-cash
- -6.52%
- DSCR
- 0.71
- GRM
- 11.1
CMA / ARV
- ARV (on-the-fly)
- $441,280
- Comps found
- 12
Show comp detail 12 sales within ~0.75 mi
| Address | Dist | Beds/Ba | Sqft | Sold | Price | $/sf | Match |
|---|---|---|---|---|---|---|---|
| 14502 SW New Dawn Rd | 0.29mi | 4/2.5 | 2,168 (-3%) | 2mo | $435,590 | $201 | 80 |
| 14512 SW New Dawn Rd | 0.30mi | 4/2.5 | 2,168 (-3%) | 2mo | $422,490 | $195 | 79 |
| 14313 SW New Dawn Rd | 0.29mi | 4/3.0 | 2,193 (-2%) | 3mo | $432,000 | $197 | 79 |
| 14215 SW New Dawn Rd | 0.34mi | 4/3.0 | 2,193 (-2%) | 2mo | $435,600 | $199 | 77 |
| 14310 SW New Dawn Rd | 0.31mi | 4/2.5 | 2,168 (-3%) | 5mo | $386,000 | $178 | 76 |
| 14320 SW New Dawn Rd | 0.32mi | 4/2.5 | 2,168 (-3%) | 5mo | $415,490 | $192 | 76 |
| 14209 SW New Dawn Rd | 0.33mi | 4/3.0 | 2,193 (-2%) | 6mo | $437,000 | $199 | 74 |
| 14219 SW New Dawn Rd | 0.37mi | 4/3.0 | 2,193 (-2%) | 6mo | $454,590 | $207 | 72 |
| 14508 SW New Dawn Rd | 0.30mi | 4/3.0 | 2,387 (+7%) | 4mo | $446,749 | $187 | 70 |
| 14402 SW New Dawn Rd | 0.30mi | 4/3.0 | 2,387 (+7%) | 4mo | $444,421 | $186 | 70 |
| 14308 SW New Dawn Rd | 0.31mi | 3/2.5 (-1) | 1,964 (-12%) | 2mo | $403,700 | $206 | 59 |
| 14318 SW New Dawn Rd | 0.32mi | 3/2.5 (-1) | 1,964 (-12%) | 5mo | $376,000 | $191 | 56 |
Match score weights: distance 35% · size 25% · config 20% · recency 20%. Top-matched comps best support the ARV.
Projected returns pro-forma
6.65% appreciation · 3.0% rent growth · sell at horizon
- IRR
- 11.2%
- Equity multiple
- 1.79×
- Total profit
- $88,333
- Equity at exit
- $268,095
- IRR
- 12.1%
- Equity multiple
- 3.59×
- Total profit
- $290,441
- Equity at exit
- $501,236
Cash invested: $111,997 (down + closing). Projections, not guarantees.
Landlord ↔ Tenant lean methodology
- Overall (STATE)
- 87 Strongly Landlord-Friendly
- State Florida
- 87 Strongly Landlord-Friendly · R+3
- County
- — inherits STATE
- City
- — inherits STATE
ZIP-level market 34956
- Home prices YoY
- 1.2%
- Active inventory
- 136
- Price-to-rent
- 11.1×
Monthly cashflow live
- Estimated rent
- $3,003 medium interval (Pro) →
- Mortgage (P&I)
- −$2,098
- Tax est. 1.5%
- −$500 /mo · $6,000/yr
- Insurance
- −$167
- Flood insurance flood zone
- −$66 /mo · $798/yr
- HOA
- −$217
- Vacancy / Maint / Mgmt
- −$631
- Net cashflow
- $-675
Break-even live
Sensitivity live
| Price | -10% $-399 | -5% $-537 | +0% $-675 | +5% $-814 | +10% $-952 |
|---|---|---|---|---|---|
| Rent | -10% $-913 | -5% $-794 | +0% $-675 | +5% $-557 | +10% $-438 |
| Rate | -1.0pp $-474 | -0.5pp $-574 | base $-675 | +0.5pp $-779 | +1.0pp $-885 |
UW: 25.0% down · 7.5% · 30yr · 1.5% tax · 5.0% vac · 8.0% maint · 8.0% mgmt
Financing live
Cash to close
- Down payment
- $99,998
- Closing costs
- $12,000
- Reserves months
- —
- Total cash needed
- —
Loan-product check · same deal, 3 products live
Conventional
25% down · 7.5% · 30yr
- Down + closing
- —
- Monthly P&I
- —
- Monthly cashflow
- —
- DSCR
- —
- Eligible?
- —
Personal DTI + credit; lowest rate.
DSCR
20% down · 8.5% · 30yr
- Down + closing
- —
- Monthly P&I
- —
- Monthly cashflow
- —
- DSCR
- —
- Eligible?
- —
No personal income docs; deal must DSCR.
Hard money
10% down · 12.0% · 12mo
- Down + closing
- —
- Monthly P&I
- —
- Monthly cashflow
- —
- DSCR
- —
- Eligible?
- —
Short-term bridge; refi at stabilization.
Rent comps 4 comps
| Address | Beds | Baths | Sqft | Rent | $/sqft | DOM | Units | Dist |
|---|---|---|---|---|---|---|---|---|
| 15693 SW Twilight St Indiantown, FL | 4.0 | 2.5 | 1895 | $3,300 | $1.74 | 23d | 1 | 0.07mi |
| 15404 SW American St Indiantown, FL | 4.0 | 2.0 | 1850 | $3,000 | $1.62 | 15d | 1 | 0.08mi |
| 15817 SW Winter Rd Indiantown, FL | 3.0 | 2.5 | 1428 | $2,300 | $1.61 | 15d | 1 | 0.14mi |
| 15760 SW Hammock Way Indiantown, FL | 3.0–4.0 | 2.0–3.5 | 1918 | $3,800 | $1.98 | 0d | 40 | 1.09mi |
HOA detail
- Monthly dues
- $217 · $2,604/yr
Listing history 4 events
-
2026-06-21days on market $399,990 Active 5 DOM
-
2026-06-18days on market $399,990 Active 2 DOM
-
2026-06-16remarks 606-char remark
-
2026-06-16$399,990 Active 1 DOM
ⓘ Source: listings_history table (triggers on properties + properties_extension) + one-shot
backfill from property_details.listing_events for pre-trigger history.
Climate risk First Street
- Flood 10/10 Extreme FEMA zone X (unshaded) · 99% chance over 30 yrs
- Wildfire 5/10 Major
- Heat 9/10 Extreme 7 d/yr ≥108°F today · 24 d/yr by 30 yrs out
- Wind 10/10 Extreme 99% chance of damaging wind over 30 yrs
- Air quality 2/10 Low 0 unhealthy d/yr today · 1 by 30 yrs out
Nearby sold comps map
Loading sold comps map…
Walkable amenities ~0.75 mi
Loading nearby amenities…
Taxation est. · year 1
- Rental income
- $36,034
- − Mortgage interest
- −$22,406
- − Property taxes
- −$6,000
- − Insurance
- −$2,797
- − Repairs & maintenance
- −$2,883
- − Management
- −$2,883
- − HOA
- −$2,604
- − Depreciation
- −$11,636
- Taxable loss
- −$15,174
- Est. tax savings @ 24.0%
- +$3,642
- After-tax cash flow
- $-4,463/yr
For passive investors: Depreciation is non-cash, so a rental often shows a tax loss while cash-flowing — sheltering income. Rental losses are passive: they offset passive income freely, and up to $25,000/yr can offset ordinary (W-2) income if you actively participate and your MAGI is under $100k (phasing out to $0 by $150k); unused losses carry forward. On sale, claimed depreciation is recaptured at up to 25%, and gains may owe capital-gains tax (a 1031 exchange can defer both). Figures are a year-1 estimate at your 24.0% rate — not tax advice; consult a CPA.
Schools (NCES district)
- District
- Martin
- NCES district ID
- 1201290
- Math proficiency
- 52% ▼ -14.00%
- Reading proficiency
- 53% ▼ -4.00%
- Median HH income
- $52,482
- Composite
- 45.1/100
- National rank
- #2690
- State rank
- #24 of 73 in FL
Livability — Indiantown
- Score
- 59/100
- State rank
- #829
- US rank
- #20298
Category grades
Schools grade is shown separately in the Schools card above.
Census & demographics
- Census place
- Indiantown, FL
- Population (ZIP)
- 9,639
Population outlook (Martin County) Hauer SSP2
- Today (2025)
- 172,383 people
- By 2030
- 180,192 · +4.5%
- By 2040
- 194,114 · +12.6%
- By 2050
- 204,992 · +18.9%
- By 2075
- 229,641 · +33.2%
- By 2100
- 232,146 · +34.7%
Race, ethnicity, and origin ACS 2023
- Neighborhood character
- Diverse neighborhood (Simpson 0.64)
- Race & ethnicity
- Hispanic / Latino 49% Black 24% White 24% Two or more races 16% Native American 5% Asian 1%
- Hispanic origin (detail)
- Mexican 21% Puerto Rican 4% Cuban 1%
- Common ancestry
- Lithuanian 1% Italian 1% Slovak 1%
- Foreign-born
- 22% · Canada
- Languages at home
- 55% English-only · Spanish 42%
Political lean MEDSL · Martin
- 2024 margin
- Solid R (+31.1) · D 34.1% · R 65.2%
- 2008→2024 swing
- -17.5pp toward R · 2008: -13.6pp · 2024: -31.1pp
- All cycles
- 2024: R+31.1 2020: R+24.6 2016: R+26.9 2012: R+22.9 2008: R+13.6
Not yet ingested
- Civics
- —
Market trends
- HPI YoY
- ▲ 6.65%
- Current HPI
- 561.896
- Rent YoY
- —
- Metro
- —
- State GDP YoY
- ▲ 3.28%
- F500 in state
- 36
Industry mix (Fortune 500 HQ in FL)
| Industry | F500 HQs | Revenue |
|---|---|---|
| Industrial Technology | 2 | $29B |
|
||
| Insurance | 2 | $17B |
|
||
| Retail | 1 | $60B |
|
||
| Technology Distribution | 1 | $58B |
|
||
| Homebuilding | 1 | $35B |
|
||
| Technology Manufacturing | 1 | $35B |
|
||
Cash-flow waterfall
monthlySold comps — $/sqft
last 12 mo · ≤1 miLoading sold comps…