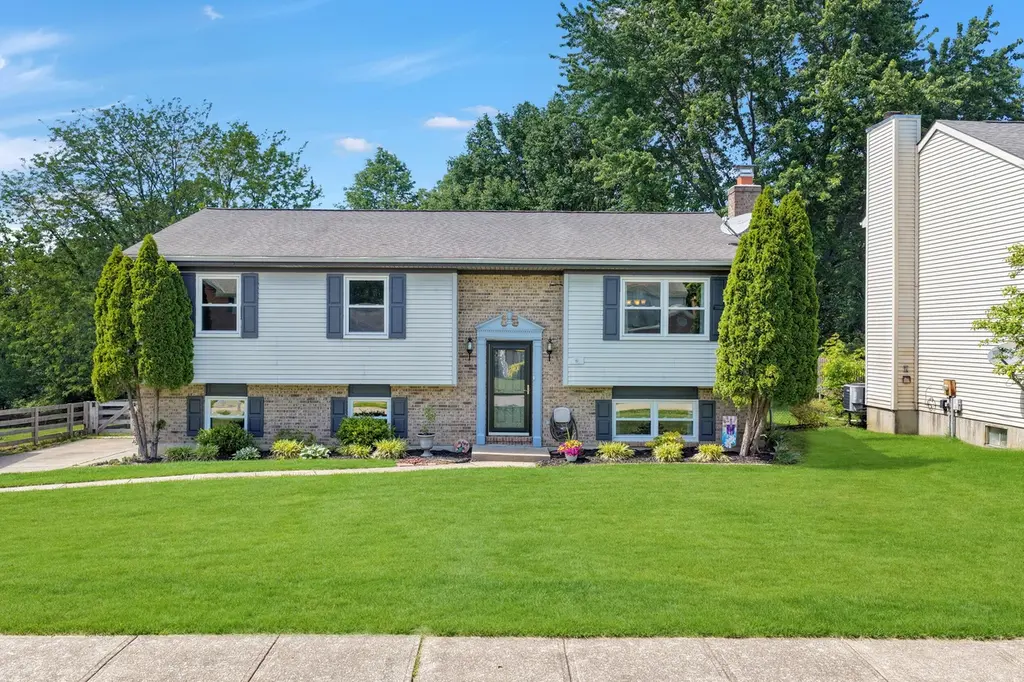
6099 Tosha Dr
Burlington, KY 41005
$312,500F
3 bd · 3.0 ba ·
1,582 sqft ·
Built 1987
· SingleFamily
· Pending
· 25 DOM
Cashflow @ list (25.0% down · 7.5%)
Estimated rent
$2,300/mo
Mortgage (P&I)
−$1,639
Tax + insurance
−$355
HOA
−$0
Vac / Maint / Mgmt
−$483
Net cashflow
$-176/mo
Annual
$-2,116/yr
Cap rate
5.62%
Cash-on-cash
-2.42%
DSCR
0.89
1% rule
0.74%
Cash to close
$87,500
Investor read
- This is a 3-bed/3.0-bath single-family listed at $312k.
- At list price, monthly cash flow is $-176 ($-2k/yr) — negative.
- To cash-flow at today's rent, offer at most $281k (10.0% below list).
- To meet the 1% rule (rent ≥ 1% of price), the offer needs to be $230k (26.4% below list).
- It's been on market 25 days — a 2% lower offer ($308k) is reasonable based on typical stale-listing flexibility.
- Recommended offer: $230k (26.4% below list) — sets the bar for 1% rule.
- Local home prices are declining (-3.0%/yr); year-one equity from $2k of loan paydown is wiped out by about $9k of value loss. Plan a longer hold.
- Location reads 77/100 on livability (#83 in KY, #2,792 nationally) — a middle-class / working-renter tenant base. Strengths: crime A+, employment A+, cost of living A+; Watch: health & safety C-, amenities F, commute F.
- Boone County (suburban): math 43% / reading 49% proficiency, ranked #12 of 165 in KY (top 7%) — families likely to look elsewhere, expect single-tenant / working-renter base with shorter leases.
- Zoned schools: Burlington Elementary School (math 44% / reading 49%, grade D-, #133 of 676 statewide, top 20%, 692 students, 46% FRL); Camp Ernst Middle School (math 28% / reading 43%, grade F, #94 of 217 statewide, top 44%, 723 students, 48% FRL); Randall K. Cooper High School (math 46% / reading 50%, grade D, #17 of 254 statewide, top 6%, 1,462 students, 30% FRL).
- Market conditions: 155 active listings in the ZIP; 1 comparable units currently listed for rent nearby; high-income renter base; 1,430 units permitted in Boone County in 2024 (928 in 5+ unit buildings).
- Boone County population projected at +24% by 2050 — long-run rental-demand tailwind backs the buy-and-hold thesis.
- 3 sale attempts since 22y ago with the ask held roughly flat each time — persistent listings suggest the price (not the market) is what's stuck; bring a comps-based counter.
- Cap rate 5.6% vs local median 4.3% in Burlington — top-decile yield for the area; either an underpriced asset or a hidden risk that comps aren't pricing in. Stress-test before assuming the spread holds.
Questions for listing agent
- What do current leases actually rent for vs. the listed asking? Can we see a recent rent roll and the last 12 months of T-12 income?
- Is there a deadline driving the sale (1031 exchange, divorce, estate, relocation)? That informs how much negotiation room exists.
- The area grade is low — what's the realistic commute time and amenity access for the typical tenant pool here? Any planned neighborhood developments (good or bad) we should know about?
- What's the average days-on-market for RENTAL listings here right now (not sales)? A rising rental-DOM trend means longer vacancies and softer asking-rent achievability than the comps imply.
- What's the recent tenant-quality profile in this submarket — average credit score on applications, eviction rate, late-payment / NSF rate, and stable-employment percentage? A property-management company in the area should have these aggregated.
- How much new for-sale + rental construction is in the pipeline within 1–3 miles? Heavy new supply typically softens prices + rents 12–24 months out; constrained supply supports both.
CashFlowRE · CFR-A8ZST9AP19WWWV
· Data 1 week ago
cashflowre.app · 2026-05-29