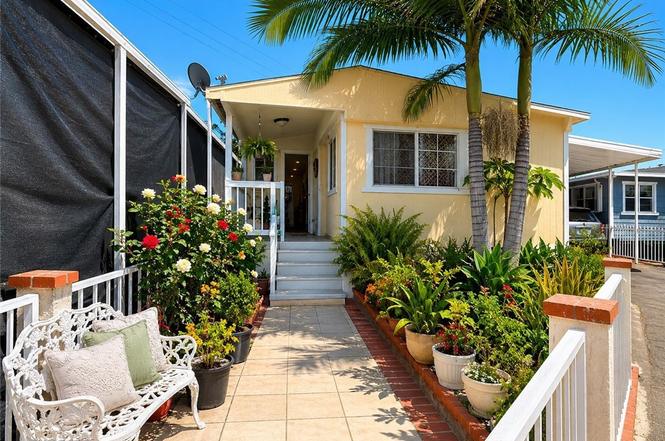
6475 Atlantic Ave #250
Long Beach, CA 90805
$167,000C+
3 bd · 1.0 ba ·
576 sqft ·
Built 1970
· Manufactured
· Active
· 11 DOM
Cashflow @ list (25.0% down · 7.5%)
Estimated rent
$2,423/mo
Mortgage (P&I)
−$876
Tax + insurance
−$278
HOA
−$0
Vac / Maint / Mgmt
−$509
Net cashflow
$760/mo
Annual
$9,123/yr
Cap rate
11.76%
Cash-on-cash
19.51%
DSCR
1.87
1% rule
1.45%
Cash to close
$46,760
Investor read
- This is a 3-bed/1.0-bath manufactured listed at $167k.
- At list price, monthly cash flow is $760 ($9k/yr) — positive.
- The deal already cash-flows at list — no discount required.
- Meets the 1% rule at list price ($2k rent vs $167k).
- Only 11 days on market — expect competitive offers; lowballing is unlikely to land.
- Local home prices are declining (-3.0%/yr); year-one equity from $1k of loan paydown is wiped out by about $5k of value loss. Plan a longer hold.
- Location reads 67/100 on livability (#319 in CA) — a middle-class / working-renter tenant base. Strengths: amenities A+, commute A+, employment B+; Watch: health & safety C-, crime F, cost of living F.
- Long Beach Unified (urban): math 34% / reading 50% proficiency, ranked #216 of 517 in CA (top 42%) — families likely to look elsewhere, expect single-tenant / working-renter base with shorter leases.
- Zoned schools: Powell Academy For Success (math 24% / reading 36%, grade F, #834 of 1,571 statewide, top 54%, 806 students, 73% FRL); Helen Keller Middle (math 51% / reading 68%, grade B, #61 of 498 statewide, top 12%, 459 students, 31% FRL); Jordan High (math 12% / reading 35%, grade F, #935 of 1,170 statewide, top 80%, 2,241 students, 66% FRL) — zoned schools at 56% FRL track the district average.
- Market conditions: Rents rising (+1.9%/yr); 100 active listings in the ZIP; 19 comparable units currently listed for rent nearby; rentals at typical pace (median 26d on market — plan ~3-4 weeks tenant-placement turnaround); 42% of comp listings sitting > 30 days — soft ceiling on asking rent; 19,697 units permitted in Los Angeles County in 2024 (9,426 in 5+ unit buildings).
- Los Angeles County population projected at +9% by 2050 — modest demand growth; plan on rents tracking national, not racing it.
- 3 sale attempts since 20y ago with the ask held roughly flat each time — persistent listings suggest the price (not the market) is what's stuck; bring a comps-based counter.
- At projected returns (-3.0% appreciation + 1.9% rent growth), your $47k cash investment doubles in ~7 years — after that, you're playing with house money.
- Cap rate 11.8% vs local median 1.9% in Long Beach — top-decile yield for the area; either an underpriced asset or a hidden risk that comps aren't pricing in. Stress-test before assuming the spread holds.
- This rent runs 40% of the median local income ($73k/yr) — at the standard rent-burdened threshold; future hikes will face affordability resistance.
Questions for listing agent
- Built in 1970 — when were the roof, HVAC, electrical panel, plumbing, and water heater last replaced?
- Is there a deadline driving the sale (1031 exchange, divorce, estate, relocation)? That informs how much negotiation room exists.
- Crime grade is F in this area — have there been break-ins, vandalism, or insurance claims at this property in the last 3 years? What carrier currently insures it and at what premium?
- What's the average days-on-market for RENTAL listings here right now (not sales)? A rising rental-DOM trend means longer vacancies and softer asking-rent achievability than the comps imply.
- What's the recent tenant-quality profile in this submarket — average credit score on applications, eviction rate, late-payment / NSF rate, and stable-employment percentage? A property-management company in the area should have these aggregated.
- How much new for-sale + rental construction is in the pipeline within 1–3 miles? Heavy new supply typically softens prices + rents 12–24 months out; constrained supply supports both.
CashFlowRE · CFR-AAB2ZSEJT4B8Z6
· Data 20 h ago
cashflowre.app · 2026-05-29