6475 Atlantic Ave #250 · Long Beach, CA
Flood risk 4/10 · Minor
- FEMA flood zone
- X
- Chance of flooding over 30 yrs
- 0.2%
- Est. flood insurance / yr
- $507 – $1,088
Fire risk 1/10 · Minimal
- Est. fire insurance / yr
- $659 – $1,223
Heat risk 4/10 · Minor
- Hot days now (above 90°F)
- 6 days/yr
- Hot days in 30 yrs
- 19 days/yr
Wind risk 1/10 · Minimal
- Chance of severe wind over 30 yrs
- —
Air-quality risk 6/10 · Moderate
- Unhealthy air days now
- 10 days/yr
- Unhealthy air days in 30 yrs
- 10 days/yr
Risk factors via First Street. Map © Google.
Why this score? — see what drove the C+ grade
The composite is a weighted blend of 9 inputs, each scored 0–100. Each bar is that input's sub-score; the figure is the points it added to the 100-point composite (weight × sub-score).
- Cash flow +30.0/30.0
- DSCR +10.0/10.0
- 1% rule +9.5/10.0
- Schools +3.7/10.0
- Livability +3.4/5.0
- Rent growth +3.0/5.0
- Condition / age +2.5/5.0
- ARV discount +0.0/15.0
- Appreciation +0.0/10.0
$167,000
🖨 Deal sheet (PDF) 📄 Offer letter ✓ Due diligence
Listing remarks
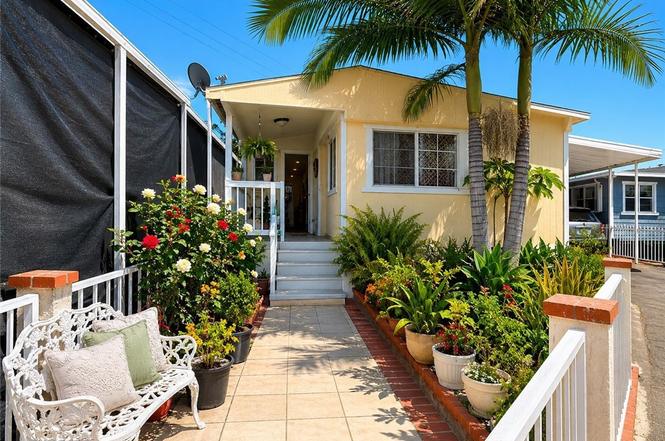
Welcome to this charming and well-maintained 3-bedroom, 1-bath manufactured home located in a desirable Long Beach community. Thoughtfully designed living space, this home maximizes functionality and comfort. The inviting interior features a bright living area, an efficient kitchen with ample cabinetry, and three versatile bedrooms perfect for a growing household, guests, or a home office. Enjoy the convenience of community amenities and a central location close to shopping, dining, major freeways, and everyday essentials. Whether you're a first-time buyer, looking to downsize, or seeking an affordable opportunity to own in Long Beach, this home is full of potential and ready for its next c
Key facts
- 3 parking spots
- Community pool
- Built 1970
Property features AI
Finance
- Other: No landscaping on lot; Directions: E Artesia Blvd is the cross street
- Financial info: Land lease of $1,600 per month (park provided); rent includes gardener and pool
- HOA & community: Part of an association; Community curbs; Park name: Villa Park Mobile Estates; Manager approval required; Pets: contact manager
Exterior
- Parking: Attached carport with 3 parking spaces
- Security: Wrought iron security fencing
- Utilities: Public sewer; District/public water; Electricity available; Water available
- Home design: Single-story home; Entry on main level; Mobile home remains (12' x 48'); Has a view
- Construction: Year built reported by seller
- Exterior features: Front porch with tile; In-ground community pool; One shed on property
Interior
- Kitchen: Kitchen present
- Bedrooms: All bedrooms on ground level
- Flooring: Tile; Vinyl; Laminate
- Bathrooms: Shower in tub; Exhaust fan
- Interior features: Ceiling fan; Smoke detector
- Laundry & utility: Washer included; Dryer included; Outdoor laundry area
Neighborhood map
What this means for you Summary
Snapshot
- This is a 3-bed/1.0-bath manufactured listed at $167k.
Deal economics
- At list price, monthly cash flow is $760 ($9k/yr) — positive.
- The deal already cash-flows at list — no discount required.
- Meets the 1% rule at list price ($2k rent vs $167k).
- Cap rate 11.8% vs local median 1.9% in Long Beach — top-decile yield for the area; either an underpriced asset or a hidden risk that comps aren't pricing in. Stress-test before assuming the spread holds.
Location & tenants
- Location reads 67/100 on livability (#319 in CA) — a middle-class / working-renter tenant base. Strengths: amenities A+, commute A+, employment B+; Watch: health & safety C-, crime F, cost of living F.
- Long Beach Unified (urban): math 34% / reading 50% proficiency, ranked #216 of 517 in CA (top 42%) — families likely to look elsewhere, expect single-tenant / working-renter base with shorter leases.
- Zoned schools: Powell Academy For Success (math 24% / reading 36%, grade F, #834 of 1,571 statewide, top 54%, 806 students, 73% FRL); Helen Keller Middle (math 51% / reading 68%, grade B, #61 of 498 statewide, top 12%, 459 students, 31% FRL); Jordan High (math 12% / reading 35%, grade F, #935 of 1,170 statewide, top 80%, 2,241 students, 66% FRL) — zoned schools at 56% FRL track the district average.
- Market conditions: Rents rising (+1.9%/yr); 100 active listings in the ZIP; 19 comparable units currently listed for rent nearby; rentals at typical pace (median 26d on market — plan ~3-4 weeks tenant-placement turnaround); 42% of comp listings sitting > 30 days — soft ceiling on asking rent; 19,697 units permitted in Los Angeles County in 2024 (9,426 in 5+ unit buildings).
- This rent runs 40% of the median local income ($73k/yr) — at the standard rent-burdened threshold; future hikes will face affordability resistance.
Forward outlook
- Local home prices are declining (-3.0%/yr); year-one equity from $1k of loan paydown is wiped out by about $5k of value loss. Plan a longer hold.
- Los Angeles County population projected at +9% by 2050 — modest demand growth; plan on rents tracking national, not racing it.
- At projected returns (-3.0% appreciation + 1.9% rent growth), your $47k cash investment doubles in ~7 years — after that, you're playing with house money.
Negotiation context
- Only 11 days on market — expect competitive offers; lowballing is unlikely to land.
- 3 sale attempts since 20y ago with the ask held roughly flat each time — persistent listings suggest the price (not the market) is what's stuck; bring a comps-based counter.
Questions for the listing agent
- Built in 1970 — when were the roof, HVAC, electrical panel, plumbing, and water heater last replaced?
- Is there a deadline driving the sale (1031 exchange, divorce, estate, relocation)? That informs how much negotiation room exists.
- Crime grade is F in this area — have there been break-ins, vandalism, or insurance claims at this property in the last 3 years? What carrier currently insures it and at what premium?
- What's the average days-on-market for RENTAL listings here right now (not sales)? A rising rental-DOM trend means longer vacancies and softer asking-rent achievability than the comps imply.
- What's the recent tenant-quality profile in this submarket — average credit score on applications, eviction rate, late-payment / NSF rate, and stable-employment percentage? A property-management company in the area should have these aggregated.
- How much new for-sale + rental construction is in the pipeline within 1–3 miles? Heavy new supply typically softens prices + rents 12–24 months out; constrained supply supports both.
Investment metrics
- 1% rule
- 1.45% ✓
- Cap rate
- 11.76%
- Cash-on-cash
- 19.51%
- DSCR
- 1.87
- GRM
- 5.7
CMA / ARV
- ARV (on-the-fly)
- $124,992
- Comps found
- 1
Show comp detail 1 sale within ~0.75 mi
| Address | Dist | Beds/Ba | Sqft | Sold | Price | $/sf | Match |
|---|---|---|---|---|---|---|---|
| 6475 ATLANTIC Ave | 0.21mi | 2/2.0 (-1) | 600 (+4%) | 19mo | $130,000 | $217 | 58 |
Match score weights: distance 35% · size 25% · config 20% · recency 20%. Top-matched comps best support the ARV.
Projected returns pro-forma
-3.0% appreciation · 1.95% rent growth · sell at horizon
- IRR
- 10.3%
- Equity multiple
- 1.40×
- Total profit
- $18,862
- Equity at exit
- $24,900
- IRR
- 18.6%
- Equity multiple
- 2.47×
- Total profit
- $68,743
- Equity at exit
- $14,439
Cash invested: $46,760 (down + closing). Projections, not guarantees.
Landlord ↔ Tenant lean methodology
- Overall (STATE)
- 18 Strongly Tenant-Friendly
- State California
- 18 Strongly Tenant-Friendly · D+13
- County
- — inherits STATE
- City
- — inherits STATE
ZIP-level market 90805
- Rents YoY
- 1.9%
- Active inventory
- 100
- Price-to-rent
- 5.7×
Monthly cashflow live
- Estimated rent
- $2,423 high interval (Pro) →
- Mortgage (P&I)
- −$876
- Tax est. 1.5%
- −$209 /mo · $2,505/yr
- Insurance
- −$70
- HOA
- −$0
- Vacancy / Maint / Mgmt
- −$509
- Net cashflow
- $760
Break-even live
Sensitivity live
| Price | -10% $876 | -5% $818 | +0% $760 | +5% $703 | +10% $645 |
|---|---|---|---|---|---|
| Rent | -10% $569 | -5% $665 | +0% $760 | +5% $856 | +10% $952 |
| Rate | -1.0pp $844 | -0.5pp $803 | base $760 | +0.5pp $717 | +1.0pp $673 |
UW: 25.0% down · 7.5% · 30yr · 1.5% tax · 5.0% vac · 8.0% maint · 8.0% mgmt
Financing live
Cash to close
- Down payment
- $41,750
- Closing costs
- $5,010
- Reserves months
- —
- Total cash needed
- —
Loan-product check · same deal, 3 products live
Conventional
25% down · 7.5% · 30yr
- Down + closing
- —
- Monthly P&I
- —
- Monthly cashflow
- —
- DSCR
- —
- Eligible?
- —
Personal DTI + credit; lowest rate.
DSCR
20% down · 8.5% · 30yr
- Down + closing
- —
- Monthly P&I
- —
- Monthly cashflow
- —
- DSCR
- —
- Eligible?
- —
No personal income docs; deal must DSCR.
Hard money
10% down · 12.0% · 12mo
- Down + closing
- —
- Monthly P&I
- —
- Monthly cashflow
- —
- DSCR
- —
- Eligible?
- —
Short-term bridge; refi at stabilization.
Rent comps 19 comps
| Address | Beds | Baths | Sqft | Rent | $/sqft | DOM | Units | Dist |
|---|---|---|---|---|---|---|---|---|
| 147 E 59th St Unit 147 Long Beach, CA | 2.0 | 2.0 | 740 | $2,650 | $3.58 | 0d | 1 | 0.61mi |
| 147 E 59th St Unit 147 A Long Beach, CA | 2.0 | 2.0 | 740 | $2,650 | $3.58 | 5d | 1 | 0.61mi |
| 195 E Hullett St Long Beach, CA | 3.0 | 1.0 | 725 | $2,595 | $3.58 | 18d | 1 | 0.70mi |
| 171 1/2 E 68th Way Long Beach, CA | 2.0 | 1.0 | 610 | $2,400 | $3.93 | 26d | 1 | 0.87mi |
| 169 E 68th Way Unit 1 Long Beach, CA | 2.0 | 1.0 | 610 | $2,400 | $3.93 | 26d | 1 | 0.88mi |
| 5557 Olive Ave Long Beach, CA | 2.0 | 1.0 | 500 | $2,800 | $5.60 | 45d | 1 | 1.00mi |
| 7029 Orange Ave Long Beach, CA | 2.0 | 1.0 | 700 | $2,519 | $3.60 | 45d | 1 | 1.02mi |
| 5476 Linden Ave Unit 6 Long Beach, CA | 2.0 | 1.0 | 525 | $2,150 | $4.10 | 45d | 1 | 1.07mi |
| 409 E Market St Long Beach, CA | 2.0 | 1.0 | 750 | $1,995 | $2.66 | 45d | 1 | 1.13mi |
| 134 E Market St Long Beach, CA | 2.0 | 1.0 | 600 | $2,000 | $3.33 | 0d | 1 | 1.19mi |
| 134 E Market St Long Beach, CA | 2.0 | 1.0 | 600 | $2,000 | $3.33 | 23d | 1 | 1.19mi |
| 134 E Market St Long Beach, CA | 2.0 | 1.0 | 600 | $2,000 | $3.33 | 45d | 1 | 1.19mi |
| 61 W Louise St Long Beach, CA | 2.0 | 1.0 | 605 | $2,650 | $4.38 | 0d | 1 | 1.21mi |
| 6843 Delta Ave Long Beach, CA | 2.0 | 1.0 | 600 | $2,600 | $4.33 | 45d | 1 | 1.24mi |
| 1164 E Market St #3 Long Beach, CA | 2.0 | 1.0 | 600 | $1,899 | $3.17 | 45d | 1 | 1.32mi |
| 1164 E Market St Unit 2 Long Beach, CA | 2.0 | 1.0 | 600 | $1,850 | $3.08 | 7d | 1 | 1.32mi |
| 1728 E Rogers St Long Beach, CA | 2.0 | 1.0 | 715 | $2,895 | $4.05 | 26d | 1 | 1.43mi |
| 1231 E 53rd St Unit A Long Beach, CA | 2.0 | 1.0 | 672 | $2,300 | $3.42 | 45d | 1 | 1.44mi |
| 1231 E 53rd St Long Beach, CA | 2.0 | 1.0 | 672 | $2,000 | $2.98 | 26d | 1 | 1.44mi |
Listing history 8 events
-
2026-06-21days on market $167,000 Active 11 DOM
-
2026-06-18days on market $167,000 Active 8 DOM
-
2026-06-17days on market $167,000 Active 7 DOM
-
2026-06-16days on market $167,000 Active 6 DOM
-
2026-06-15days on market $167,000 Active 5 DOM
-
2026-06-13days on market $167,000 Active 3 DOM
-
2026-06-13remarks 699-char remark
-
2026-06-13$167,000 Active 2 DOM
ⓘ Source: listings_history table (triggers on properties + properties_extension) + one-shot
backfill from property_details.listing_events for pre-trigger history.
Climate risk First Street
- Flood 4/10 Moderate FEMA zone X · 20% chance over 30 yrs
- Wildfire 1/10 Low
- Heat 4/10 Moderate 6 d/yr ≥90°F today · 19 d/yr by 30 yrs out
- Wind 1/10 Low
- Air quality 6/10 Major 10 unhealthy d/yr today · 10 by 30 yrs out
Nearby sold comps map
Loading sold comps map…
Walkable amenities ~0.75 mi
Loading nearby amenities…
Taxation est. · year 1
- Rental income
- $29,079
- − Mortgage interest
- −$9,355
- − Property taxes
- −$2,505
- − Insurance
- −$835
- − Repairs & maintenance
- −$2,326
- − Management
- −$2,326
- − Depreciation
- −$4,858
- Taxable income
- $6,873
- Est. tax owed @ 24.0%
- −$1,650
- After-tax cash flow
- $7,473/yr
For passive investors: Depreciation is non-cash, so a rental often shows a tax loss while cash-flowing — sheltering income. Rental losses are passive: they offset passive income freely, and up to $25,000/yr can offset ordinary (W-2) income if you actively participate and your MAGI is under $100k (phasing out to $0 by $150k); unused losses carry forward. On sale, claimed depreciation is recaptured at up to 25%, and gains may owe capital-gains tax (a 1031 exchange can defer both). Figures are a year-1 estimate at your 24.0% rate — not tax advice; consult a CPA.
Schools (NCES district)
- District
- Long Beach Unified
- NCES district ID
- 0622500
- Math proficiency
- 34% ▼ -11.00%
- Reading proficiency
- 50% ▼ -4.00%
- Median HH income
- $56,092
- Composite
- 36.67/100
- National rank
- #4607
- State rank
- #216 of 517 in CA
Livability — Long Beach
- Score
- 67/100
- State rank
- #319
- US rank
- #10758
Category grades
Schools grade is shown separately in the Schools card above.
Census & demographics
- Census place
- Long Beach, CA
- County
- Los Angeles County · 9,444,647 people
- City population
- 466,088
- Metro
- Los Angeles-Long Beach-Anaheim, CA
- Population (ZIP)
- 92,402
- Household income
- $73,415
- Rent vs Own
- Severe rent burden
- 4834.0
Population outlook (Los Angeles County) Hauer SSP2
- Today (2025)
- 10,940,515 people
- By 2030
- 11,256,481 · +2.9%
- By 2040
- 11,729,929 · +7.2%
- By 2050
- 11,948,407 · +9.2%
- By 2075
- 11,818,114 · +8.0%
- By 2100
- 10,842,928 · -0.9%
Race, ethnicity, and origin ACS 2023
- Neighborhood character
- Diverse neighborhood (Simpson 0.60)
- Race & ethnicity
- Hispanic / Latino 59% Black 18% Two or more races 16% Asian 11% White 8% Native American 2%
- Hispanic origin (detail)
- Mexican 48%
- Common ancestry
- Lithuanian 1% Slovak 1%
- Foreign-born
- 30% · Canada, Vietnam
- Languages at home
- 41% English-only · Spanish 49% Other Asian/Pacific 5% Tagalog/Filipino 2%
Political lean MEDSL · Los Angeles
- 2024 margin
- Solid D (+32.9) · D 64.8% · R 31.9% · Other 3.3%
- 2008→2024 swing
- -7.4pp toward R · 2008: 40.4pp · 2024: 32.9pp
- All cycles
- 2024: D+32.9 2020: D+44.2 2016: D+48.0 2012: D+40.0 2008: D+40.4
Not yet ingested
- Civics
- —
Market trends
- HPI YoY
- ▼ -817.43%
- Current HPI
- 456.7913
- Rent YoY
- ▲ 1.95%
- Metro
- Los Angeles-Long Beach-Anaheim, CA
- State GDP YoY
- ▲ 3.21%
- F500 in state
- 116
Industry mix (Fortune 500 HQ in CA)
| Industry | F500 HQs | Revenue |
|---|---|---|
| Technology | 27 | $1,492B |
|
||
| Financial Services | 3 | $174B |
|
||
| Retail | 3 | $44B |
|
||
| Insurance | 3 | $26B |
|
||
| Media / Entertainment | 2 | $115B |
|
||
| Pharmaceuticals / Biotech | 2 | $62B |
|
||
Price history
+377.1% since first listed5 events — show timeline
- 2026-06-09 Listed $167,000 CRMLS
- 2007-06-14 Listing Removed — CRMLS
- 2007-02-13 Listed $20,000 CRMLS
- 2006-11-19 Listing Removed — CRMLS
- 2006-07-18 Listed $35,000 CRMLS
Cash-flow waterfall
monthlySold comps — $/sqft
last 12 mo · ≤1 miLoading sold comps…