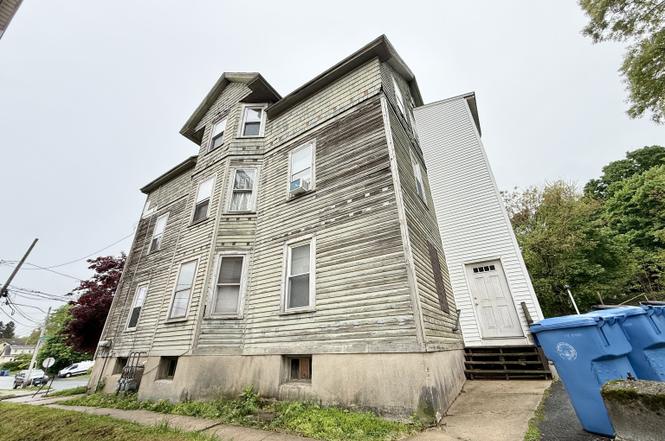
23 Chapman Ct
New Britain, CT 06051
$389,000B-
6 bd · 3.0 ba ·
3,420 sqft ·
Built 1925
· MultiFamily
· Active
· 7 DOM
Cashflow @ list (25.0% down · 7.5%)
Estimated rent
$4,442/mo
Mortgage (P&I)
−$2,040
Tax + insurance
−$850
HOA
−$0
Vac / Maint / Mgmt
−$933
Net cashflow
$619/mo
Annual
$7,434/yr
Cap rate
8.20%
Cash-on-cash
6.82%
DSCR
1.30
1% rule
1.14%
Cash to close
$108,920
Investor read
- This is a 3 × 1-bed/1.0-bath units multifamily listed at $389k.
- At list price, monthly cash flow is $619 ($7k/yr) — positive. Per door: $206/mo.
- The deal already cash-flows at list — no discount required.
- Meets the 1% rule at list price ($4k rent vs $389k).
- Only 7 days on market — expect competitive offers; lowballing is unlikely to land.
- In year one you build about $42k of equity ($3k loan paydown + $39k appreciation (10.0% local appreciation)).
- Location reads 74/100 on livability (#67 in CT, #4,936 nationally) — a middle-class / working-renter tenant base. Strengths: health & safety A+, cost of living A, housing A; Watch: crime D, employment D, schools F.
- New Britain School District (suburban): math 6% / reading 17% proficiency, ranked #153 of 153 in CT (top 100%) — low school quality limits family demand, transient renter base, plan for 1-2y turnover; 71% free/reduced lunch — lower-income household profile, screen leases tightly.
- Watch-outs: built in 1925 — expect roof / HVAC / electrical / plumbing capex.
- Market conditions: Rents soft (-0.6%/yr); 63 active listings in the ZIP; 1 comparable units currently listed for rent nearby; 1,867 units permitted in Capitol Planning Region in 2024 (1,399 in 5+ unit buildings).
- At projected returns (10.0% appreciation + 0.0% rent growth), your $109k cash investment doubles in ~3 years — after that, you're playing with house money.
- By year 2, paydown + projected appreciation supports a ~$67k cash-out refi (75% LTV) — recoverable capital for the next deal without selling this one.
- Cap rate 8.2% vs local median 4.4% in New Britain — top-decile yield for the area; either an underpriced asset or a hidden risk that comps aren't pricing in. Stress-test before assuming the spread holds.
- At $4,442/mo this rent would consume 104% of the median local household income ($51k/yr) (locally 2100% of renters already pay >50% of income on rent) — very limited rent-growth headroom before tenants either downsize or default.
Questions for listing agent
- Can we see the unit-by-unit rent roll, current vacancy, and any below-market leases? What's the average tenancy length?
- What capital expenditures (roof, boiler, parking lot, exteriors) have been made in the last 5 years, and what's planned in the next 2?
- Built in 1925 — when were the roof, HVAC, electrical panel, plumbing, and water heater last replaced?
- Is there a deadline driving the sale (1031 exchange, divorce, estate, relocation)? That informs how much negotiation room exists.
- Schools are F-rated, which usually means shorter tenancies and higher turnover. Who's the typical renter profile here, and what's been the actual vacancy rate?
- Crime grade is D in this area — have there been break-ins, vandalism, or insurance claims at this property in the last 3 years? What carrier currently insures it and at what premium?
- What's the average days-on-market for RENTAL listings here right now (not sales)? A rising rental-DOM trend means longer vacancies and softer asking-rent achievability than the comps imply.
- What's the recent tenant-quality profile in this submarket — average credit score on applications, eviction rate, late-payment / NSF rate, and stable-employment percentage? A property-management company in the area should have these aggregated.
CashFlowRE · CFR-AC82ZN4KHT68G8
· Data 2 days ago
cashflowre.app · 2026-05-29