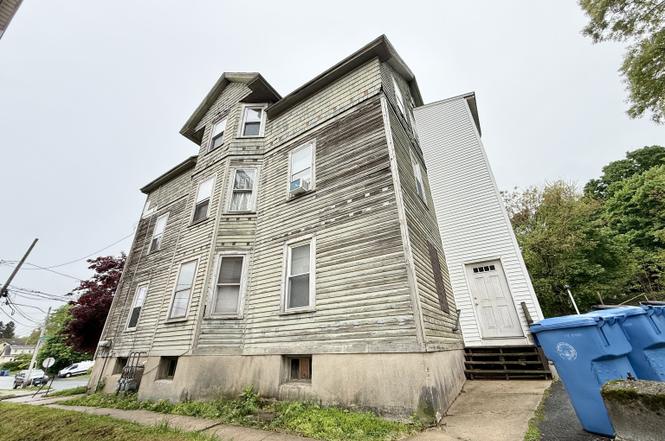
 Triplex
23 Chapman Ct · New Britain, CT
Flood risk No data
- FEMA flood zone
- —
- Chance of flooding over 30 yrs
- —
- Est. flood insurance / yr
- —
Fire risk No data
- Est. fire insurance / yr
- —
Heat risk No data
- Hot days now (above threshold)
- —
- Hot days in 30 yrs
- —
Wind risk No data
- Chance of severe wind over 30 yrs
- —
Air-quality risk No data
- Unhealthy air days now
- —
- Unhealthy air days in 30 yrs
- —
Risk factors via First Street. Map © Google.
Why this score? — see what drove the B- grade
The composite is a weighted blend of 9 inputs, each scored 0–100. Each bar is that input's sub-score; the figure is the points it added to the 100-point composite (weight × sub-score).
- Cash flow +22.0/30.0
- ARV discount +12.2/15.0
- Appreciation +10.0/10.0
- DSCR +7.0/10.0
- 1% rule +6.4/10.0
- Livability +3.7/5.0
- Condition / age +2.5/5.0
- Rent growth +2.4/5.0
- Schools +1.0/10.0
$389,000
🖨 Deal sheet 📄 Offer letter ✓ Due diligence
Multi-family units
County records classify this as Multi-Family (2-4 Unit). Listing-text estimate: 3 units. confirmed
Listing remarks
Excellent investment opportunity in New Britain! This triplex features three well-proportioned units, each offering 1 bedroom and 1 full bathroom. The property provides a great opportunity for investors seeking rental income or owner-occupants looking to offset living expenses. Each unit offers comfortable living space with abundant natural light and functional layouts. Conveniently located near shopping, dining, parks, public transportation, and major commuter routes, making it attractive to tenants and owners alike. Don't miss the chance to own this versatile multi-family property with strong income potential.
Key facts
- Three units
- Triplex
- Functional layouts
Tags
Property features AI
Exterior
- Parking: Detached 2-car garage
- Utilities: Public water (in street); Public sewer (in street); Electric hot water
- Home design: Multi-family property (3-family)
- Construction: Frame construction; Concrete foundation; Built as a multi-family residence
- Exterior features: Vinyl and aluminum siding; Asphalt shingle roof
Interior
- Bedrooms: 4 bedrooms
- Bathrooms: 3 full bathrooms
- Heating & cooling: Wood/coal stove heating; Electric hot water
- Interior features: 12 total rooms; Full, unfinished basement; Walk-up attic
Neighborhood map
What this means for you Summary
Snapshot
- This is a 3 × 1-bed/1.0-bath units multifamily listed at $389k.
Deal economics
- At list price, monthly cash flow is $619 ($7k/yr) — positive. Per door: $206/mo.
- The deal already cash-flows at list — no discount required.
- Meets the 1% rule at list price ($4k rent vs $389k).
- Cap rate 8.2% vs local median 4.4% in New Britain — top-decile yield for the area; either an underpriced asset or a hidden risk that comps aren't pricing in. Stress-test before assuming the spread holds.
Location & tenants
- Location reads 74/100 on livability (#67 in CT, #4,936 nationally) — a middle-class / working-renter tenant base. Strengths: health & safety A+, cost of living A, housing A; Watch: crime D, employment D, schools F.
- New Britain School District (suburban): math 6% / reading 17% proficiency, ranked #153 of 153 in CT (top 100%) — low school quality limits family demand, transient renter base, plan for 1-2y turnover; 71% free/reduced lunch — lower-income household profile, screen leases tightly.
- Market conditions: Rents soft (-0.6%/yr); 63 active listings in the ZIP; 1 comparable units currently listed for rent nearby; 1,867 units permitted in Capitol Planning Region in 2024 (1,399 in 5+ unit buildings).
- At $4,442/mo this rent would consume 104% of the median local household income ($51k/yr) (locally 2100% of renters already pay >50% of income on rent) — very limited rent-growth headroom before tenants either downsize or default.
Forward outlook
- In year one you build about $42k of equity ($3k loan paydown + $39k appreciation (10.0% local appreciation)).
- At projected returns (10.0% appreciation + 0.0% rent growth), your $109k cash investment doubles in ~3 years — after that, you're playing with house money.
- By year 2, paydown + projected appreciation supports a ~$67k cash-out refi (75% LTV) — recoverable capital for the next deal without selling this one.
Negotiation context
- Only 7 days on market — expect competitive offers; lowballing is unlikely to land.
Risks & watch-outs
- Watch-outs: built in 1925 — expect roof / HVAC / electrical / plumbing capex.
Questions for the listing agent
- Can we see the unit-by-unit rent roll, current vacancy, and any below-market leases? What's the average tenancy length?
- What capital expenditures (roof, boiler, parking lot, exteriors) have been made in the last 5 years, and what's planned in the next 2?
- Built in 1925 — when were the roof, HVAC, electrical panel, plumbing, and water heater last replaced?
- Is there a deadline driving the sale (1031 exchange, divorce, estate, relocation)? That informs how much negotiation room exists.
- Schools are F-rated, which usually means shorter tenancies and higher turnover. Who's the typical renter profile here, and what's been the actual vacancy rate?
- Crime grade is D in this area — have there been break-ins, vandalism, or insurance claims at this property in the last 3 years? What carrier currently insures it and at what premium?
- What's the average days-on-market for RENTAL listings here right now (not sales)? A rising rental-DOM trend means longer vacancies and softer asking-rent achievability than the comps imply.
- What's the recent tenant-quality profile in this submarket — average credit score on applications, eviction rate, late-payment / NSF rate, and stable-employment percentage? A property-management company in the area should have these aggregated.
- How much new apartment / multifamily construction is in the pipeline within 1–3 miles? Heavy new supply (>2% of stock underway) typically softens rents 12–24 months out; light construction supports rent growth.
Investment metrics
- 1% rule
- 1.14% ✓
- Cap rate
- 8.20%
- Cash-on-cash
- 6.82%
- DSCR
- 1.30
- GRM
- 7.3
CMA / ARV
- ARV (on-the-fly)
- $434,340
- Comps found
- 12
Show comp detail 12 sales within ~0.75 mi
| Address | Dist | Beds/Ba | Sqft | Sold | Price | $/sf | Match |
|---|---|---|---|---|---|---|---|
| 36 Carlson St | 0.06mi | 6/3.0 | 3,420 (0%) | 10mo | $435,000 | $127 | 89 |
| 116 Belden St | 0.40mi | 6/3.0 | 3,606 (+5%) | 8mo | $287,000 | $80 | 66 |
| 162 Jubilee St | 0.26mi | 7/3.0 (+1) | 3,263 (-5%) | 13mo | $520,000 | $159 | 64 |
| 540 Church St | 0.42mi | 6/3.0 | 3,078 (-10%) | 1mo | $480,000 | $156 | 63 |
| 87 Belden St | 0.43mi | 6/3.0 | 3,588 (+5%) | 12mo | $460,000 | $128 | 61 |
| 62 Woodland St | 0.34mi | 5/3.0 (-1) | 3,312 (-3%) | 15mo | $410,000 | $124 | 61 |
| 73 Linden St | 0.38mi | 6/3.0 | 3,864 (+13%) | 1mo | $450,000 | $116 | 60 |
| 427 Church St | 0.60mi | 6/3.0 | 3,405 (-0%) | 15mo | $445,000 | $131 | 59 |
| 712 Stanley St | 0.68mi | 6/2.0 | 3,268 (-4%) | 10mo | $355,000 | $109 | 49 |
| 101 Fairview St | 0.66mi | 6/4.0 | 3,231 (-6%) | 15mo | $372,500 | $115 | 44 |
| 402 Church St | 0.63mi | 7/2.0 (+1) | 3,744 (+10%) | 5mo | $450,000 | $120 | 42 |
| 182 West St | 0.62mi | 6/3.0 | 2,910 (-15%) | 7mo | $485,000 | $167 | 40 |
Match score weights: distance 35% · size 25% · config 20% · recency 20%. Top-matched comps best support the ARV.
Projected returns pro-forma
10.0% appreciation · 0.0% rent growth · sell at horizon
- IRR
- 28.0%
- Equity multiple
- 3.19×
- Total profit
- $238,487
- Equity at exit
- $350,442
- IRR
- 23.5%
- Equity multiple
- 6.95×
- Total profit
- $648,349
- Equity at exit
- $755,741
Cash invested: $108,920 (down + closing). Projections, not guarantees.
Landlord ↔ Tenant lean methodology
- Overall (STATE)
- 27 Tenant-Leaning
- State Connecticut
- 27 Tenant-Leaning · D+7
- County
- — inherits STATE
- City
- — inherits STATE
ZIP-level market 06051
- Home prices YoY
- 9.0%
- Rents YoY
- -0.6%
- Active inventory
- 63
- Price-to-rent
- 21.9×
Monthly cashflow live
- Estimated rent
- $4,442 high interval (Pro) →
- Mortgage (P&I)
- −$2,040
- Tax from tax record
- −$688 /mo · $8,252/yr
- Insurance
- −$162
- HOA
- −$0
- Vacancy / Maint / Mgmt
- −$933
- Net cashflow
- $619
Break-even live
3-unit breakdown (identical units grouped — click to expand)
| Units | Beds | Baths | Est. rent |
|---|---|---|---|
| 3× units | 1 | 1 | $4,443 |
| #1 | 1 | 1 | $1,481 |
| #2 | 1 | 1 | $1,481 |
| #3 | 1 | 1 | $1,481 |
| Total (3 units) | $4,442 | ||
UW: 25.0% down · 7.5% · 30yr · 1.5% tax · 5.0% vac · 8.0% maint · 8.0% mgmt
Financing live
Cash to close
- Down payment
- $97,250
- Closing costs
- $11,670
- Reserves months
- —
- Total cash needed
- —
Loan-product check · same deal, 3 products live
Conventional
25% down · 7.5% · 30yr
- Down + closing
- —
- Monthly P&I
- —
- Monthly cashflow
- —
- DSCR
- —
- Eligible?
- —
Personal DTI + credit; lowest rate.
DSCR
20% down · 8.5% · 30yr
- Down + closing
- —
- Monthly P&I
- —
- Monthly cashflow
- —
- DSCR
- —
- Eligible?
- —
No personal income docs; deal must DSCR.
Hard money
10% down · 12.0% · 12mo
- Down + closing
- —
- Monthly P&I
- —
- Monthly cashflow
- —
- DSCR
- —
- Eligible?
- —
Short-term bridge; refi at stabilization.
Rent comps 1 comps
| Address | Beds | Baths | Sqft | Rent | $/sqft | DOM | Units | Dist |
|---|---|---|---|---|---|---|---|---|
| 151 Fairview St New Britain, CT | 6.0 | 3.0 | 4098 | $1,800 | $0.44 | 3d | 1 | 0.60mi |
Listing history 7 events
-
2026-06-18days on market $389,000 Active 7 DOM
-
2026-06-17days on market $389,000 Active 6 DOM
-
2026-06-16days on market $389,000 Active 5 DOM
-
2026-06-15days on market $389,000 Active 4 DOM
-
2026-06-13days on market $389,000 Active 2 DOM
-
2026-06-13remarks 619-char remark
-
2026-06-13$389,000 Active 1 DOM
ⓘ Source: listings_history table (triggers on properties + properties_extension) + one-shot
backfill from property_details.listing_events for pre-trigger history.
Tax reassessment forecast CT · Partial reset (capped growth)
- Current annual tax
- $8,252 · $688/mo
- Projected year-2 tax
- $8,288 · $691/mo
- Expected delta
- +$36/yr (+$3/mo · 0.4%)
ⓘ Screening estimate from a state-policy table — verify with the county assessor before closing.
Nearby sold comps map
Loading sold comps map…
Walkable amenities ~0.75 mi
Loading nearby amenities…
Taxation est. · year 1
- Rental income
- $53,304
- − Mortgage interest
- −$21,790
- − Property taxes
- −$8,252
- − Insurance
- −$1,945
- − Repairs & maintenance
- −$4,264
- − Management
- −$4,264
- − Depreciation
- −$11,316
- Taxable income
- $1,472
- Est. tax owed @ 24.0%
- −$353
- After-tax cash flow
- $7,080/yr
For passive investors: Depreciation is non-cash, so a rental often shows a tax loss while cash-flowing — sheltering income. Rental losses are passive: they offset passive income freely, and up to $25,000/yr can offset ordinary (W-2) income if you actively participate and your MAGI is under $100k (phasing out to $0 by $150k); unused losses carry forward. On sale, claimed depreciation is recaptured at up to 25%, and gains may owe capital-gains tax (a 1031 exchange can defer both). Figures are a year-1 estimate at your 24.0% rate — not tax advice; consult a CPA.
Schools (NCES district)
- District
- New Britain School District
- NCES district ID
- 0902670
- Math proficiency
- 6% ▼ -6.00%
- Reading proficiency
- 17% ▼ -5.00%
- Median HH income
- $40,827
- Composite
- 9.95/100
- National rank
- #9816
- State rank
- #153 of 153 in CT
Livability — New Britain
- Score
- 74/100
- State rank
- #67
- US rank
- #4936
Category grades
Schools grade is shown separately in the Schools card above.
Census & demographics
- Census place
- New Britain, CT
- County
- Hartford County · 754,208 people
- City population
- 66,322
- Metro
- Hartford-East Hartford-Middletown, CT
- Population (ZIP)
- 29,548
- Household income
- $51,022
- Rent vs Own
- Severe rent burden
- 2100.0
Population outlook (Capitol County) Hauer SSP2
- By 2040
- 1,063,519
Race, ethnicity, and origin ACS 2023
- Neighborhood character
- Diverse neighborhood (Simpson 0.63)
- Race & ethnicity
- Hispanic / Latino 52% White 30% Two or more races 17% Black 11% Asian 2%
- Hispanic origin (detail)
- Mexican 2% Puerto Rican 40% Dominican 4%
- Common ancestry
- Romanian 7% Lithuanian 6% Slovak 1%
- Foreign-born
- 15% · Canada, Jamaica
- Languages at home
- 51% English-only · Spanish 39% Russian/Polish/Slavic 6% Arabic 3%
Political lean MEDSL · Capitol
- 2024 margin
- Strong D (+21.9) · D 60.1% · R 38.2% · Other 1.7%
- All cycles
- 2024: D+21.9
Not yet ingested
- Civics
- —
Market trends
- HPI YoY
- ▲ 31.52%
- Current HPI
- 382.7816
- Rent YoY
- ▼ -0.58%
- Metro
- Hartford-East Hartford-Middletown, CT
- State GDP YoY
- ▲ 1.06%
- F500 in state
- 38
Industry mix (Fortune 500 HQ in CT)
| Industry | F500 HQs | Revenue |
|---|---|---|
| Industrial Machinery | 4 | $38B |
|
||
| Insurance | 3 | $71B |
|
||
| Financial Services | 2 | $25B |
|
||
| Transportation / Logistics | 2 | $18B |
|
||
| Healthcare | 1 | $247B |
|
||
| Telecommunications | 1 | $55B |
|
||
Price history
1 event — show timeline
- 2026-06-11 Listed $389,000 Smart MLS
Property tax history
+4.2%/yrLatest (2025): $8,252 · +2.3% YoY. Source: county tax records.
Cash-flow waterfall
monthlySold comps — $/sqft
last 12 mo · ≤1 miLoading sold comps…