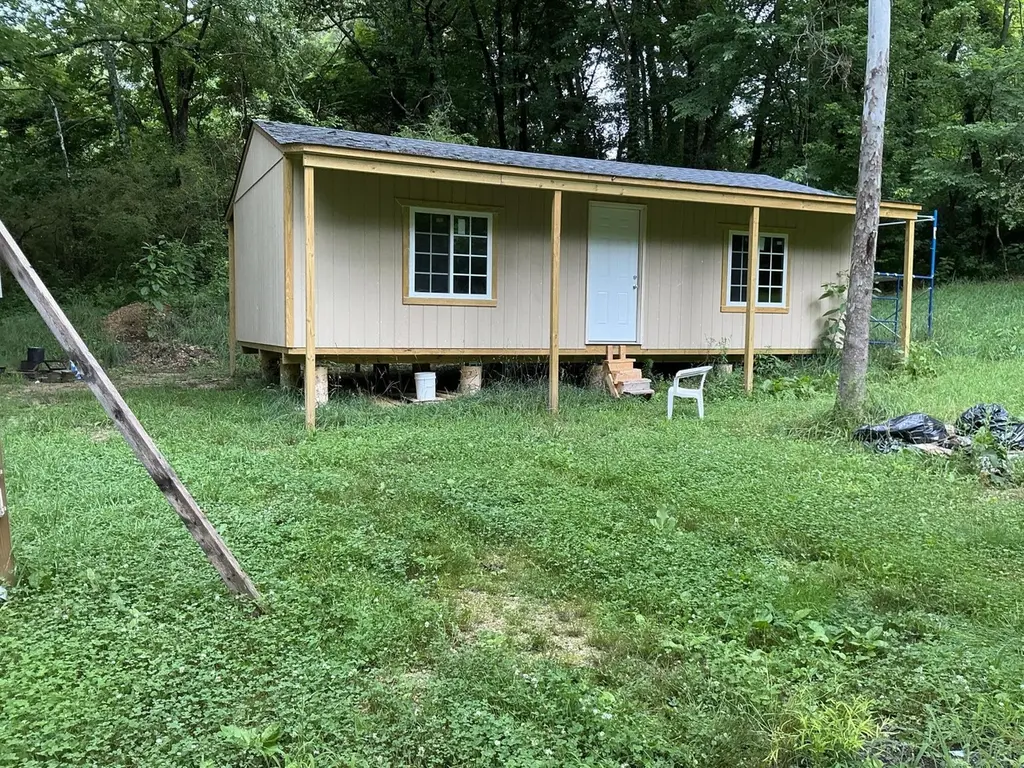
409 Florence St
Lakeview, GA 30741
$79,000B-
1 bd · None ba ·
512 sqft ·
Built 2023
· Other
· Active
· 10 DOM
Cashflow @ list (25.0% down · 7.5%)
Estimated rent
$1,033/mo
Mortgage (P&I)
−$414
Tax + insurance
−$55
HOA
−$0
Vac / Maint / Mgmt
−$217
Net cashflow
$347/mo
Annual
$4,164/yr
Cap rate
11.56%
Cash-on-cash
18.83%
DSCR
1.84
1% rule
1.31%
Cash to close
$22,120
Investor read
- This is a 1-bed/?-bath other listed at $79k.
- At list price, monthly cash flow is $347 ($4k/yr) — positive.
- The deal already cash-flows at list — no discount required.
- Meets the 1% rule at list price ($1k rent vs $79k).
- Only 10 days on market — expect competitive offers; lowballing is unlikely to land.
- Local home prices are declining (-3.0%/yr); year-one equity from $546 of loan paydown is wiped out by about $2k of value loss. Plan a longer hold.
- Location reads 69/100 on livability (#106 in GA) — a middle-class / working-renter tenant base. Strengths: cost of living A+, housing A+, crime B; Watch: amenities F, commute F.
- Walker County (rural): math 25% / reading 29% proficiency, ranked #114 of 174 in GA (top 66%) — low school quality limits family demand, transient renter base, plan for 1-2y turnover; 61% free/reduced lunch — lower-income household profile, screen leases tightly.
- Zoned schools: Rock Spring Elementary School (math 17% / reading 27%, grade F, #810 of 1,228 statewide, top 69%, 412 students, 55% FRL).
- Market conditions: Rents rising fast (+7.4%/yr); 425 active listings in the ZIP; 6 comparable units currently listed for rent nearby; rentals at typical pace (median 23d on market — plan ~3-4 weeks tenant-placement turnaround); 347 units permitted in Walker County in 2024 (24 in 5+ unit buildings).
- Walker County population projected at -16% by 2050 — secular population decline; favor cash flow + early exit over multi-decade hold.
- 2 sale attempts with the ask held roughly flat each time — persistent listings suggest the price (not the market) is what's stuck; bring a comps-based counter.
- At projected returns (-3.0% appreciation + 7.4% rent growth), your $22k cash investment doubles in ~6 years — after that, you're playing with house money.
- Climate carrying-cost: extreme-heat days projected 7→19/yr by 2055 (HVAC capex compounding) — expect insurance premiums to compound above CPI over the hold.
- Cap rate 11.6% vs local median 4.9% in Lakeview — top-decile yield for the area; either an underpriced asset or a hidden risk that comps aren't pricing in. Stress-test before assuming the spread holds.
Questions for listing agent
- Is there a deadline driving the sale (1031 exchange, divorce, estate, relocation)? That informs how much negotiation room exists.
- Schools are F-rated, which usually means shorter tenancies and higher turnover. Who's the typical renter profile here, and what's been the actual vacancy rate?
- What's the average days-on-market for RENTAL listings here right now (not sales)? A rising rental-DOM trend means longer vacancies and softer asking-rent achievability than the comps imply.
- What's the recent tenant-quality profile in this submarket — average credit score on applications, eviction rate, late-payment / NSF rate, and stable-employment percentage? A property-management company in the area should have these aggregated.
- How much new for-sale + rental construction is in the pipeline within 1–3 miles? Heavy new supply typically softens prices + rents 12–24 months out; constrained supply supports both.
CashFlowRE · CFR-ACE4MTDK5HERV2
· Data 2 days ago
cashflowre.app · 2026-05-29