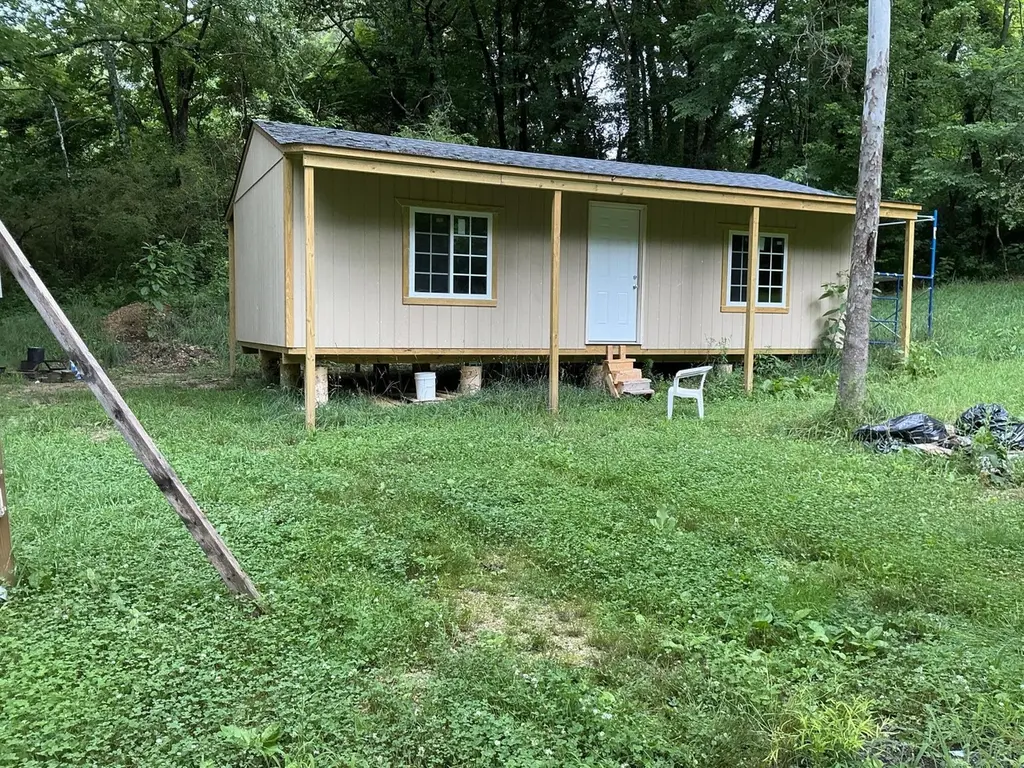
 🏗️ New Construction
409 Florence St · Lakeview, GA
Flood risk 1/10 · Minimal
- FEMA flood zone
- X (unshaded)
- Chance of flooding over 30 yrs
- 0.0%
- Est. flood insurance / yr
- $507 – $1,088
Fire risk 2/10 · Minimal
- Est. fire insurance / yr
- $963 – $1,789
Heat risk 5/10 · Moderate
- Hot days now (above 105°F)
- 7 days/yr
- Hot days in 30 yrs
- 19 days/yr
Wind risk 4/10 · Minor
- Chance of severe wind over 30 yrs
- 12.0%
Air-quality risk 3/10 · Minor
- Unhealthy air days now
- 2 days/yr
- Unhealthy air days in 30 yrs
- 2 days/yr
Risk factors via First Street. Map © Google.
Why this score? — see what drove the B- grade
The composite is a weighted blend of 9 inputs, each scored 0–100. Each bar is that input's sub-score; the figure is the points it added to the 100-point composite (weight × sub-score).
- Cash flow +30.0/30.0
- DSCR +10.0/10.0
- 1% rule +8.1/10.0
- ARV discount +7.5/15.0
- Rent growth +4.4/5.0
- Livability +3.5/5.0
- Condition / age +2.5/5.0
- Schools +2.3/10.0
- Appreciation +0.0/10.0
$79,000
🖨 Deal sheet 📄 Offer letter ✓ Due diligence
Listing remarks MLS
Bring Your Vision to Life! Opportunity awaits with this partially completed small home, framed and ready for your personal touch. Design the interior to suit your needs with the freedom to choose wall placement, electrical layout, and plumbing finishes. The septic system has already been approved and installed, providing a great head start toward completion. Tucked away among the trees and currently the only home on Florence Street just off Rosa, this property offers a peaceful setting with convenient access to area shopping, restaurants, and popular destinations including Lake Winnepesaukah Amusement Park, Costco Wholesale, and downtown Chattanooga. Whether you're looking to create a cozy personal retreat, investment property, or potential short-term rental (subject to local regulations), this unique property offers endless possibilities. A 14' x 20' workshop provides additional space for storage, hobbies, or projects. Enjoy privacy, natural surroundings, and the chance to finish this home exactly the way you've imagined. Rare opportunity to create something special in a convenient location close to everything Chattanooga has to offer!
Key facts
- 14 x 20 workshop
- 0.5 acre lot
- Built 2023
Tags
Property features AI
Exterior
- Parking: Driveway; RV access/parking
- Utilities: Public water available; Septic tank; Electricity available; Cable available; Phone available
- Home design: Residential cabin (single-family); One story; Under construction / New construction; Shingle roof
- Construction: Wood siding; Pillar/post/pier foundation; Built as new construction (under construction)
- Exterior features: Private yard; Cleared, level lot; County road frontage with public maintained asphalt road; Outbuilding
Interior
- Bedrooms: 2 total rooms
- Flooring: No flooring specified
- Heating & cooling: No heating; No cooling
- Interior features: Other interior features
- Laundry & utility: No laundry hookups indicated
Neighborhood map
What this means for you Summary
Snapshot
- This is a 1-bed/?-bath other listed at $79k.
Deal economics
- At list price, monthly cash flow is $347 ($4k/yr) — positive.
- The deal already cash-flows at list — no discount required.
- Meets the 1% rule at list price ($1k rent vs $79k).
- Cap rate 11.6% vs local median 4.9% in Lakeview — top-decile yield for the area; either an underpriced asset or a hidden risk that comps aren't pricing in. Stress-test before assuming the spread holds.
Location & tenants
- Location reads 69/100 on livability (#106 in GA) — a middle-class / working-renter tenant base. Strengths: cost of living A+, housing A+, crime B; Watch: amenities F, commute F.
- Walker County (rural): math 25% / reading 29% proficiency, ranked #114 of 174 in GA (top 66%) — low school quality limits family demand, transient renter base, plan for 1-2y turnover; 61% free/reduced lunch — lower-income household profile, screen leases tightly.
- Zoned schools: Rock Spring Elementary School (math 17% / reading 27%, grade F, #810 of 1,228 statewide, top 69%, 412 students, 55% FRL).
- Market conditions: Rents rising fast (+7.4%/yr); 425 active listings in the ZIP; 6 comparable units currently listed for rent nearby; rentals at typical pace (median 23d on market — plan ~3-4 weeks tenant-placement turnaround); 347 units permitted in Walker County in 2024 (24 in 5+ unit buildings).
Forward outlook
- Local home prices are declining (-3.0%/yr); year-one equity from $546 of loan paydown is wiped out by about $2k of value loss. Plan a longer hold.
- Walker County population projected at -16% by 2050 — secular population decline; favor cash flow + early exit over multi-decade hold.
- At projected returns (-3.0% appreciation + 7.4% rent growth), your $22k cash investment doubles in ~6 years — after that, you're playing with house money.
Negotiation context
- Only 10 days on market — expect competitive offers; lowballing is unlikely to land.
- 2 sale attempts with the ask held roughly flat each time — persistent listings suggest the price (not the market) is what's stuck; bring a comps-based counter.
Risks & watch-outs
- Climate carrying-cost: extreme-heat days projected 7→19/yr by 2055 (HVAC capex compounding) — expect insurance premiums to compound above CPI over the hold.
Questions for the listing agent
- Is there a deadline driving the sale (1031 exchange, divorce, estate, relocation)? That informs how much negotiation room exists.
- Schools are F-rated, which usually means shorter tenancies and higher turnover. Who's the typical renter profile here, and what's been the actual vacancy rate?
- What's the average days-on-market for RENTAL listings here right now (not sales)? A rising rental-DOM trend means longer vacancies and softer asking-rent achievability than the comps imply.
- What's the recent tenant-quality profile in this submarket — average credit score on applications, eviction rate, late-payment / NSF rate, and stable-employment percentage? A property-management company in the area should have these aggregated.
- How much new for-sale + rental construction is in the pipeline within 1–3 miles? Heavy new supply typically softens prices + rents 12–24 months out; constrained supply supports both.
Investment metrics
- 1% rule
- 1.31% ✓
- Cap rate
- 11.56%
- Cash-on-cash
- 18.83%
- DSCR
- 1.84
- GRM
- 6.4
CMA / ARV
No comps found within radius.
Projected returns pro-forma
-3.0% appreciation · 7.44% rent growth · sell at horizon
- IRR
- 15.1%
- Equity multiple
- 1.64×
- Total profit
- $14,093
- Equity at exit
- $11,779
- IRR
- 26.7%
- Equity multiple
- 3.82×
- Total profit
- $62,300
- Equity at exit
- $6,830
Cash invested: $22,120 (down + closing). Projections, not guarantees.
Landlord ↔ Tenant lean methodology
- Overall (STATE)
- 90 Strongly Landlord-Friendly
- State Georgia
- 90 Strongly Landlord-Friendly · R+3
- County
- — inherits STATE
- City
- — inherits STATE
ZIP-level market 30741
- Home prices YoY
- -30.7%
- Rents YoY
- 7.4%
- Active inventory
- 425
- Price-to-rent
- 6.4×
Monthly cashflow live
- Estimated rent
- $1,033 high interval (Pro) →
- Mortgage (P&I)
- −$414
- Tax from tax record
- −$22 /mo · $266/yr
- Insurance
- −$33
- HOA
- −$0
- Vacancy / Maint / Mgmt
- −$217
- Net cashflow
- $347
Break-even live
UW: 25.0% down · 7.5% · 30yr · 1.5% tax · 5.0% vac · 8.0% maint · 8.0% mgmt
Financing live
Cash to close
- Down payment
- $19,750
- Closing costs
- $2,370
- Reserves months
- —
- Total cash needed
- —
Loan-product check · same deal, 3 products live
Conventional
25% down · 7.5% · 30yr
- Down + closing
- —
- Monthly P&I
- —
- Monthly cashflow
- —
- DSCR
- —
- Eligible?
- —
Personal DTI + credit; lowest rate.
DSCR
20% down · 8.5% · 30yr
- Down + closing
- —
- Monthly P&I
- —
- Monthly cashflow
- —
- DSCR
- —
- Eligible?
- —
No personal income docs; deal must DSCR.
Hard money
10% down · 12.0% · 12mo
- Down + closing
- —
- Monthly P&I
- —
- Monthly cashflow
- —
- DSCR
- —
- Eligible?
- —
Short-term bridge; refi at stabilization.
Rent comps 6 comps
| Address | Beds | Baths | Sqft | Rent | $/sqft | DOM | Units | Dist |
|---|---|---|---|---|---|---|---|---|
| 47 Bryan Ln Rossville, GA | 1.0 | 1.0 | 600 | $875 | $1.46 | 13d | 1 | 0.70mi |
| 124 Callan Dr Rossville, GA | 1.0 | 1.0 | 600 | $899 | $1.50 | 23d | 1 | 1.08mi |
| 3380 Shadowlawn Dr Unit 2 Chattanooga, TN | 2.0 | 2.0 | 629 | $1,323 | $2.10 | 13d | 1 | 1.09mi |
| 2027 Lee St East Ridge, TN | 2.0 | 1.0 | 655 | $1,275 | $1.95 | 23d | 1 | 1.35mi |
| 2904 E 37th St Unit 1 Chattanooga, TN | 1.0 | 1.0 | 502 | $850 | $1.69 | 13d | 1 | 1.38mi |
| 4278 Spriggs St Unit 1 Chattanooga, TN | 1.0 | 1.0 | 750 | $795 | $1.06 | 23d | 1 | 1.45mi |
Listing history 9 events
-
2026-06-18days on market $79,000 Active 10 DOM
-
2026-06-17days on market $79,000 Active 9 DOM
-
2026-06-16days on market $79,000 Active 8 DOM
-
2026-06-15days on market $79,000 Active 7 DOM
-
2026-06-14days on market $79,000 Active 5 DOM
-
2026-06-13days on market $79,000 Active 4 DOM
-
2026-06-10days on market $79,000 Active 2 DOM
-
2026-06-09remarks 699-char remark
-
2026-06-09$79,000 Active 1 DOM
ⓘ Source: listings_history table (triggers on properties + properties_extension) + one-shot
backfill from property_details.listing_events for pre-trigger history.
Tax reassessment forecast GA · Resets to sale price
- Current annual tax
- $266 · $22/mo
- Projected year-2 tax
- $727 · $61/mo
- Expected delta
- +$460/yr (+$38/mo · 172.8%)
ⓘ Screening estimate from a state-policy table — verify with the county assessor before closing.
Climate risk First Street
- Flood 1/10 Low FEMA zone X (unshaded) · 0% chance over 30 yrs
- Wildfire 2/10 Low
- Heat 5/10 Major 7 d/yr ≥105°F today · 19 d/yr by 30 yrs out
- Wind 4/10 Moderate 12% chance of damaging wind over 30 yrs
- Air quality 3/10 Moderate 2 unhealthy d/yr today · 2 by 30 yrs out
Nearby sold comps map
Loading sold comps map…
Walkable amenities ~0.75 mi
Loading nearby amenities…
Taxation est. · year 1
- Rental income
- $12,402
- − Mortgage interest
- −$4,425
- − Property taxes
- −$266
- − Insurance
- −$395
- − Repairs & maintenance
- −$992
- − Management
- −$992
- − Depreciation
- −$2,298
- Taxable income
- $3,032
- Est. tax owed @ 24.0%
- −$728
- After-tax cash flow
- $3,437/yr
For passive investors: Depreciation is non-cash, so a rental often shows a tax loss while cash-flowing — sheltering income. Rental losses are passive: they offset passive income freely, and up to $25,000/yr can offset ordinary (W-2) income if you actively participate and your MAGI is under $100k (phasing out to $0 by $150k); unused losses carry forward. On sale, claimed depreciation is recaptured at up to 25%, and gains may owe capital-gains tax (a 1031 exchange can defer both). Figures are a year-1 estimate at your 24.0% rate — not tax advice; consult a CPA.
Schools (NCES district)
- District
- Walker County
- NCES district ID
- 1305370
- Math proficiency
- 25% ▼ -10.00%
- Reading proficiency
- 29% ▼ -10.00%
- Median HH income
- $39,889
- Composite
- 22.74/100
- National rank
- #8035
- State rank
- #114 of 174 in GA
Livability — Lakeview
- Score
- 69/100
- State rank
- #106
- US rank
- #8207
Category grades
Schools grade is shown separately in the Schools card above.
Census & demographics
- Census place
- Lakeview, GA
- County
- Walker County · 48,831 people
- City population
- 30,041
- Metro
- Chattanooga, TN-GA
- Population (ZIP)
- 30,041
- Household income
- $58,834
- Rent vs Own
- Severe rent burden
- 834.0
Population outlook (Walker County) Hauer SSP2
- Today (2025)
- 66,050 people
- By 2030
- 64,305 · -2.6%
- By 2040
- 60,127 · -9.0%
- By 2050
- 55,551 · -15.9%
- By 2075
- 44,886 · -32.0%
- By 2100
- 34,015 · -48.5%
Race, ethnicity, and origin ACS 2023
- Neighborhood character
- Predominantly White (86%)
- Race & ethnicity
- White 86% Black 5% Two or more races 5% Hispanic / Latino 5%
- Common ancestry
- Slovak 3% Iranian 2% Italian 1%
- Foreign-born
- 2% · Canada
- Languages at home
- 96% English-only · Spanish 3%
Political lean MEDSL · Walker
- 2024 margin
- Solid R (+59.3) · D 20.1% · R 79.4%
- 2008→2024 swing
- -12.5pp toward R · 2008: -46.8pp · 2024: -59.3pp
- All cycles
- 2024: R+59.3 2020: R+59.3 2016: R+61.5 2012: R+50.2 2008: R+46.8
Not yet ingested
- Civics
- —
Market trends
- HPI YoY
- ▼ -118.05%
- Current HPI
- 267.0047
- Rent YoY
- ▲ 7.44%
- Metro
- Chattanooga, TN-GA
- State GDP YoY
- ▲ 2.66%
- F500 in state
- 28
Industry mix (Fortune 500 HQ in GA)
| Industry | F500 HQs | Revenue |
|---|---|---|
| Paper / Packaging | 2 | $29B |
|
||
| Retail | 1 | $160B |
|
||
| Transportation / Logistics | 1 | $91B |
|
||
| Airlines | 1 | $62B |
|
||
| Consumer Goods | 1 | $47B |
|
||
| Utilities | 1 | $25B |
|
||
Price history
+0.0% since first listed2 events — show timeline
- 2026-06-08 Listed $79,000 GAMLS
- 2026-06-08 Listed $79,000 GCAR
Property tax history
+6.2%/yrLatest (2025): $266 · +264.3% YoY. Source: county tax records.
Cash-flow waterfall
monthlySold comps — $/sqft
last 12 mo · ≤1 miLoading sold comps…