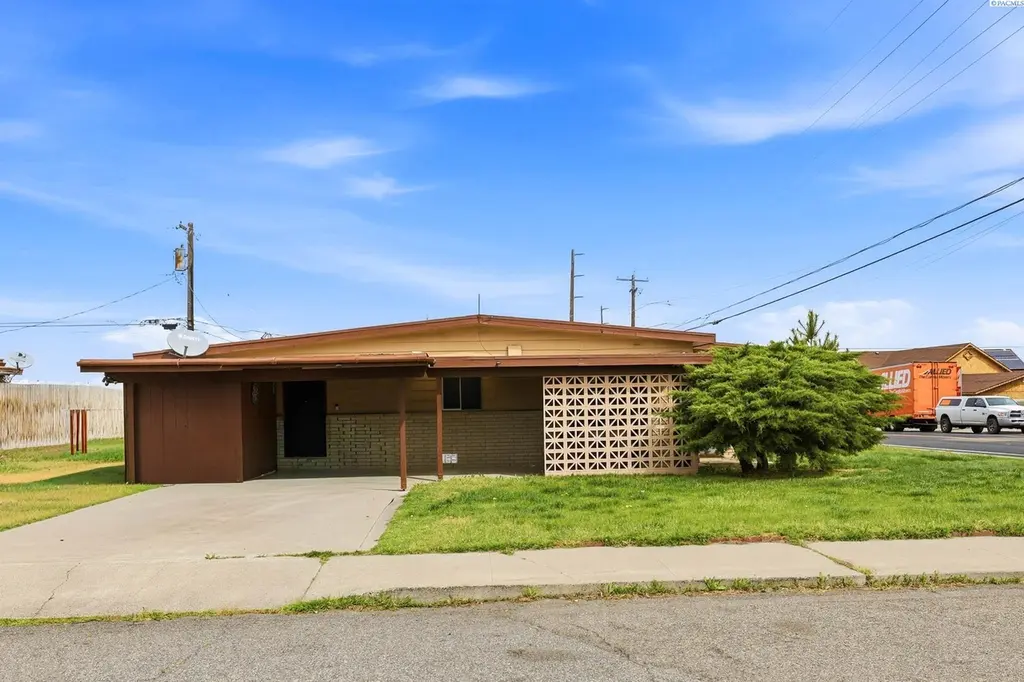
903 N Neel St
Kennewick, WA 99336
$419,900D
4 bd · 3.0 ba ·
2,564 sqft ·
Built 1961
· MultiFamily
· Pending
· 3 DOM
Cashflow @ list (25.0% down · 7.5%)
Estimated rent
$3,401/mo
Mortgage (P&I)
−$2,202
Tax + insurance
−$443
HOA
−$0
Vac / Maint / Mgmt
−$714
Net cashflow
$42/mo
Annual
$499/yr
Cap rate
6.41%
Cash-on-cash
0.42%
DSCR
1.02
1% rule
0.81%
Cash to close
$117,572
Investor read
- This is a 2 × 3-bed/1.75-bath units multifamily listed at $420k.
- At list price, monthly cash flow is $42 ($499/yr) — positive. Per door: $21/mo.
- The deal already cash-flows at list — no discount required.
- To meet the 1% rule (rent ≥ 1% of price), the offer needs to be $340k (19.0% below list).
- Only 3 days on market — expect competitive offers; lowballing is unlikely to land.
- Recommended offer: $340k (19.0% below list) — sets the bar for 1% rule.
- Local home prices are declining (-3.0%/yr); year-one equity from $3k of loan paydown is wiped out by about $13k of value loss. Plan a longer hold.
- Location reads 78/100 on livability (#131 in WA, #2,599 nationally) — a middle-class / working-renter tenant base. Strengths: commute A+, housing A+, health & safety A; Watch: amenities D+, crime F.
- Kennewick School District (urban): math 43% / reading 58% proficiency, ranked #141 of 291 in WA (top 48%) — acceptable for families but not a draw, mixed tenant base, ~2y average lease.
- Zoned schools: Hawthorne Elementary School (474 students, 80% FRL); Highlands Middle School (750 students, 84% FRL); Kamiakin High School (1,884 students, 43% FRL) — zoned schools average 69% FRL vs 48% district-wide (21 pts higher); higher-poverty schools than district average — tighter screening recommended.
- Market conditions: Rents rising (+3.4%/yr); 292 active listings in the ZIP; 2 comparable units currently listed for rent nearby; 1,532 units permitted in Benton County in 2024 (389 in 5+ unit buildings).
- Benton County population projected at +32% by 2050 — long-run rental-demand tailwind backs the buy-and-hold thesis.
- Cap rate 6.4% vs local median 3.3% in Kennewick — top-decile yield for the area; either an underpriced asset or a hidden risk that comps aren't pricing in. Stress-test before assuming the spread holds.
- At $3,401/mo this rent would consume 65% of the median local household income ($63k/yr) (locally 2605% of renters already pay >50% of income on rent) — very limited rent-growth headroom before tenants either downsize or default.
Questions for listing agent
- Can we see the unit-by-unit rent roll, current vacancy, and any below-market leases? What's the average tenancy length?
- What capital expenditures (roof, boiler, parking lot, exteriors) have been made in the last 5 years, and what's planned in the next 2?
- Built in 1961 — when were the roof, HVAC, electrical panel, plumbing, and water heater last replaced?
- Is there a deadline driving the sale (1031 exchange, divorce, estate, relocation)? That informs how much negotiation room exists.
- Schools are D-rated, which usually means shorter tenancies and higher turnover. Who's the typical renter profile here, and what's been the actual vacancy rate?
- Crime grade is F in this area — have there been break-ins, vandalism, or insurance claims at this property in the last 3 years? What carrier currently insures it and at what premium?
- The area grade is low — what's the realistic commute time and amenity access for the typical tenant pool here? Any planned neighborhood developments (good or bad) we should know about?
- What's the average days-on-market for RENTAL listings here right now (not sales)? A rising rental-DOM trend means longer vacancies and softer asking-rent achievability than the comps imply.
CashFlowRE · CFR-ACSHHP6231KWVV
· Data 4 weeks ago
cashflowre.app · 2026-05-29