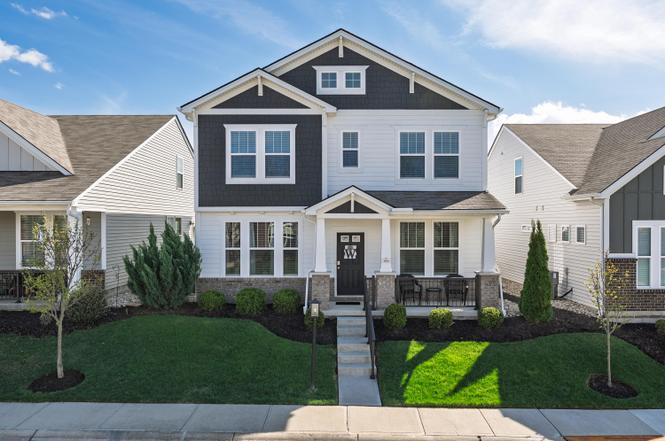
1984 Prosperity Ct
Union, KY 41091
$389,900D
3 bd · 2.5 ba ·
2,397 sqft ·
Built 2021
· SingleFamily
· Active
· 90 DOM
Cashflow @ list (25.0% down · 7.5%)
Estimated rent
$2,900/mo
Mortgage (P&I)
−$2,045
Tax + insurance
−$376
HOA
−$0
Vac / Maint / Mgmt
−$609
Net cashflow
$-130/mo
Annual
$-1,555/yr
Cap rate
5.89%
Cash-on-cash
-1.42%
DSCR
0.94
1% rule
0.74%
Cash to close
$109,172
Investor read
- This is a 3-bed/2.5-bath single-family listed at $390k.
- At list price, monthly cash flow is $-130 ($-2k/yr) — negative.
- To cash-flow at today's rent, offer at most $367k (5.9% below list).
- To meet the 1% rule (rent ≥ 1% of price), the offer needs to be $290k (25.6% below list).
- It's been on market 90 days — a 6% lower offer ($367k) is reasonable based on typical stale-listing flexibility.
- Recommended offer: $290k (25.6% below list) — sets the bar for 1% rule.
- Local home prices are declining (-3.0%/yr); year-one equity from $3k of loan paydown is wiped out by about $12k of value loss. Plan a longer hold.
- Location reads 78/100 on livability (#79 in KY, #2,521 nationally) — a middle-class / working-renter tenant base. Strengths: crime A+, employment A+, housing A+; Watch: amenities F, commute F.
- Boone County (suburban): math 43% / reading 49% proficiency, ranked #12 of 165 in KY (top 7%) — families likely to look elsewhere, expect single-tenant / working-renter base with shorter leases.
- Zoned schools: Erpenbeck Elementary School (math 65% / reading 68%, grade B+, #17 of 676 statewide, top 2%, 702 students, 28% FRL); Ockerman Middle School (math 35% / reading 50%, grade D-, #47 of 217 statewide, top 22%, 653 students, 47% FRL); Larry A. Ryle High School (math 50% / reading 48%, grade D, #15 of 254 statewide, top 6%, 2,013 students, 32% FRL).
- Market conditions: 469 active listings in the ZIP; 1 comparable units currently listed for rent nearby; 1,430 units permitted in Boone County in 2024 (928 in 5+ unit buildings).
- Boone County population projected at +24% by 2050 — long-run rental-demand tailwind backs the buy-and-hold thesis.
- 3 sale attempts with the ask held roughly flat each time — persistent listings suggest the price (not the market) is what's stuck; bring a comps-based counter.
- Cap rate 5.9% vs local median 2.4% in Union — top-decile yield for the area; either an underpriced asset or a hidden risk that comps aren't pricing in. Stress-test before assuming the spread holds.
Questions for listing agent
- What do current leases actually rent for vs. the listed asking? Can we see a recent rent roll and the last 12 months of T-12 income?
- It's been on market 90 days. Have you received any prior offers? Is the seller open to a 26% concession, seller financing, or rate buy-down credit?
- Why hasn't it sold? Are there any deal-killer items the seller is aware of (foundation, flood, title, zoning, code violations)?
- Is there a deadline driving the sale (1031 exchange, divorce, estate, relocation)? That informs how much negotiation room exists.
- Schools are A-rated — typically a magnet for longer-tenancy family renters. What's the average tenant stay here, and is there a school-zone premium baked into asking?
- The area grade is low — what's the realistic commute time and amenity access for the typical tenant pool here? Any planned neighborhood developments (good or bad) we should know about?
- What's the average days-on-market for RENTAL listings here right now (not sales)? A rising rental-DOM trend means longer vacancies and softer asking-rent achievability than the comps imply.
- What's the recent tenant-quality profile in this submarket — average credit score on applications, eviction rate, late-payment / NSF rate, and stable-employment percentage? A property-management company in the area should have these aggregated.
CashFlowRE · CFR-ACTBZ3992FCH29
· Data 2 weeks ago
cashflowre.app · 2026-05-29