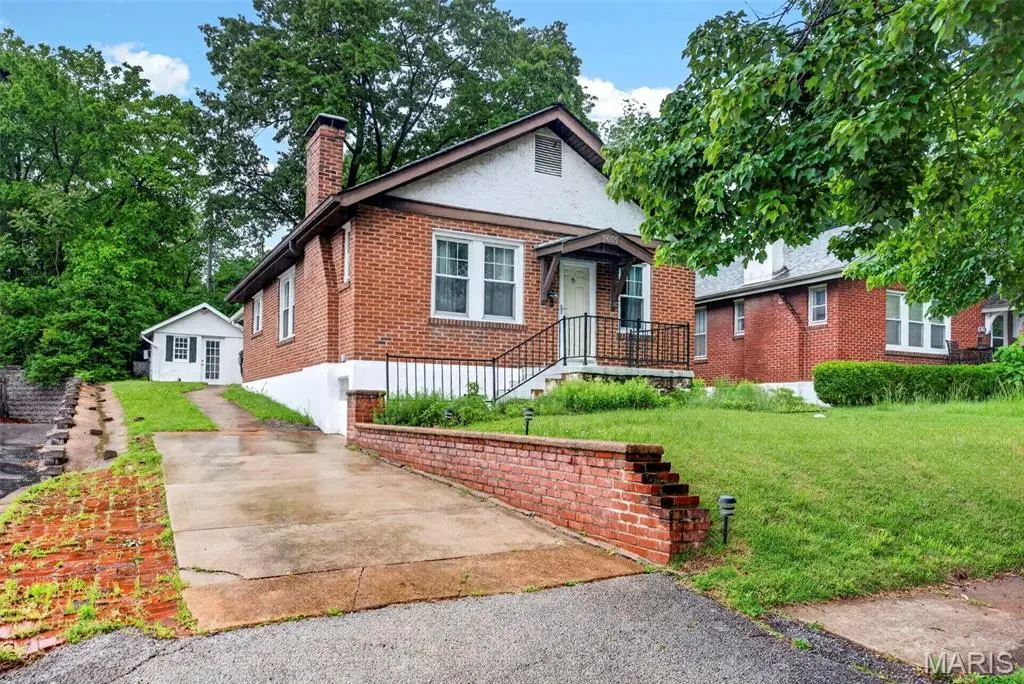
2655 Louis Ave
Brentwood, MO 63144
$259,900D
2 bd · 1.0 ba ·
1,370 sqft ·
Built 1929
· SingleFamily
· Pending
· 28 DOM
Cashflow @ list (25.0% down · 7.5%)
Estimated rent
$1,878/mo
Mortgage (P&I)
−$1,363
Tax + insurance
−$357
HOA
−$0
Vac / Maint / Mgmt
−$394
Net cashflow
$-237/mo
Annual
$-2,841/yr
Cap rate
5.20%
Cash-on-cash
-3.90%
DSCR
0.83
1% rule
0.72%
Cash to close
$72,772
Investor read
- This is a 2-bed/1.0-bath single-family listed at $260k.
- At list price, monthly cash flow is $-237 ($-3k/yr) — negative.
- To cash-flow at today's rent, offer at most $218k (16.1% below list).
- To meet the 1% rule (rent ≥ 1% of price), the offer needs to be $188k (27.8% below list).
- It's been on market 28 days — a 2% lower offer ($256k) is reasonable based on typical stale-listing flexibility.
- Recommended offer: $188k (27.8% below list) — sets the bar for 1% rule.
- Local home prices are declining (-3.0%/yr); year-one equity from $2k of loan paydown is wiped out by about $8k of value loss. Plan a longer hold.
- Location reads 84/100 on livability (#6 in MO, #689 nationally) — a professional / high-income tenant draw. Strengths: employment A+, housing A+, cost of living B; Watch: crime C-.
- Brentwood (suburban): math 65% / reading 66% proficiency, ranked #4 of 324 in MO (top 1%) — acceptable for families but not a draw, mixed tenant base, ~2y average lease; only 18% free/reduced lunch — higher-income household profile.
- Zoned schools: Mark Twain Elem. (math 67% / reading 67%, grade B+, #46 of 1,115 statewide, top 5%, 157 students, 18% FRL); Brentwood Middle (math 67% / reading 62%, grade A-, #5 of 391 statewide, top 2%, 163 students, 24% FRL); Brentwood High (math 62% / reading 74%, grade B, #12 of 521 statewide, top 2%, 191 students, 30% FRL).
- Watch-outs: built in 1929 — expect roof / HVAC / electrical / plumbing capex.
- Market conditions: Rents rising (+1.5%/yr); 130 active listings in the ZIP; 39 comparable units currently listed for rent nearby; rentals leasing fast (median 13d on market — plan ~1-2 weeks tenant-placement turnaround); solid renter incomes; 920 units permitted in St. Louis County in 2024 (250 in 5+ unit buildings).
- 3 sale attempts since 8y ago with the ask held roughly flat each time — persistent listings suggest the price (not the market) is what's stuck; bring a comps-based counter.
- Climate carrying-cost: extreme-heat days projected 7→21/yr by 2055 (HVAC capex compounding) — expect insurance premiums to compound above CPI over the hold.
Questions for listing agent
- What do current leases actually rent for vs. the listed asking? Can we see a recent rent roll and the last 12 months of T-12 income?
- Built in 1929 — when were the roof, HVAC, electrical panel, plumbing, and water heater last replaced?
- Is there a deadline driving the sale (1031 exchange, divorce, estate, relocation)? That informs how much negotiation room exists.
- Schools are A-rated — typically a magnet for longer-tenancy family renters. What's the average tenant stay here, and is there a school-zone premium baked into asking?
- The area grade is low — what's the realistic commute time and amenity access for the typical tenant pool here? Any planned neighborhood developments (good or bad) we should know about?
- What's the average days-on-market for RENTAL listings here right now (not sales)? A rising rental-DOM trend means longer vacancies and softer asking-rent achievability than the comps imply.
- What's the recent tenant-quality profile in this submarket — average credit score on applications, eviction rate, late-payment / NSF rate, and stable-employment percentage? A property-management company in the area should have these aggregated.
- How much new for-sale + rental construction is in the pipeline within 1–3 miles? Heavy new supply typically softens prices + rents 12–24 months out; constrained supply supports both.
CashFlowRE · CFR-ADS2PY40MY0NQ0
· Data 1 week ago
cashflowre.app · 2026-05-29