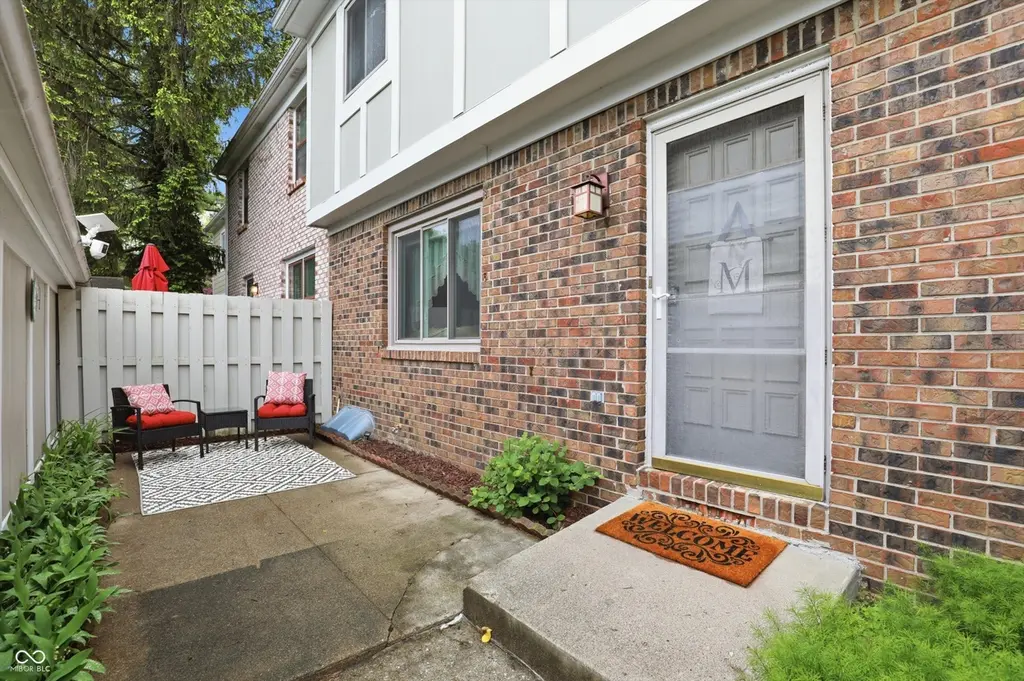
362 Carmelaire Ct
Carmel, IN 46032
$285,000D
3 bd · 2.5 ba ·
1,560 sqft ·
Built 1979
· Condo
· Pending
· 3 DOM
Cashflow @ list (25.0% down · 7.5%)
Estimated rent
$2,586/mo
Mortgage (P&I)
−$1,495
Tax + insurance
−$320
HOA
−$385
Vac / Maint / Mgmt
−$543
Net cashflow
$-156/mo
Annual
$-1,876/yr
Cap rate
5.63%
Cash-on-cash
-2.35%
DSCR
0.90
1% rule
0.91%
Cash to close
$79,800
Investor read
- This is a 3-bed/2.5-bath condo listed at $285k.
- At list price, monthly cash flow is $-156 ($-2k/yr) — negative.
- To cash-flow at today's rent, offer at most $257k (9.7% below list).
- To meet the 1% rule (rent ≥ 1% of price), the offer needs to be $259k (9.3% below list).
- Only 3 days on market — expect competitive offers; lowballing is unlikely to land.
- Recommended offer: $257k (9.7% below list) — sets the bar for cash-flow.
- Local home prices are declining (-3.0%/yr); year-one equity from $2k of loan paydown is wiped out by about $9k of value loss. Plan a longer hold.
- Location reads 84/100 on livability (#7 in IN, #726 nationally) — a professional / high-income tenant draw. Strengths: crime A+, amenities A+, employment A+; Watch: commute F.
- Carmel Clay Schools (urban): math 68% / reading 70% proficiency, ranked #1 of 301 in IN (top 0%) — acceptable for families but not a draw, mixed tenant base, ~2y average lease; only 7% free/reduced lunch — higher-income household profile.
- Zoned schools: Carmel Elementary School (math 75% / reading 61%, grade B+, #49 of 994 statewide, top 5%, 624 students, 22% FRL); Carmel Middle School (math 46% / reading 61%, grade C+, #32 of 330 statewide, top 10%, 1,064 students, 20% FRL); Carmel High School (math 77% / reading 90%, grade A, #3 of 369 statewide, top 1%, 5,192 students, 13% FRL).
- Market conditions: Rents rising fast (+6.5%/yr); 346 active listings in the ZIP; 38 comparable units currently listed for rent nearby; rentals leasing fast (median 1d on market — plan ~1-2 weeks tenant-placement turnaround); high-income renter base; 4,661 units permitted in Hamilton County in 2024 (1,528 in 5+ unit buildings).
- Hamilton County population projected at +44% by 2050 — long-run rental-demand tailwind backs the buy-and-hold thesis.
- 3 sale attempts since 3y ago with the ask held roughly flat each time — persistent listings suggest the price (not the market) is what's stuck; bring a comps-based counter.
- Cap rate 5.6% vs local median 2.7% in Carmel — top-decile yield for the area; either an underpriced asset or a hidden risk that comps aren't pricing in. Stress-test before assuming the spread holds.
Questions for listing agent
- What do current leases actually rent for vs. the listed asking? Can we see a recent rent roll and the last 12 months of T-12 income?
- Built in 1979 — when were the roof, HVAC, electrical panel, plumbing, and water heater last replaced?
- What does the HOA fee cover, when was the last increase, and are there any pending special assessments or reserve-fund shortfalls?
- Any open or pending special assessments — roof, HVAC, plumbing, elevator, façade? What's the per-unit balance and payoff schedule, and is the seller paying it off at close or rolling it to the buyer?
- Is there a deadline driving the sale (1031 exchange, divorce, estate, relocation)? That informs how much negotiation room exists.
- Schools are A-rated — typically a magnet for longer-tenancy family renters. What's the average tenant stay here, and is there a school-zone premium baked into asking?
- The area grade is low — what's the realistic commute time and amenity access for the typical tenant pool here? Any planned neighborhood developments (good or bad) we should know about?
- What's the average days-on-market for RENTAL listings here right now (not sales)? A rising rental-DOM trend means longer vacancies and softer asking-rent achievability than the comps imply.
CashFlowRE · CFR-AE7DPB6C2DE5C6
· Data 1 week ago
cashflowre.app · 2026-05-29