362 Carmelaire Ct · Carmel, IN
Flood risk 1/10 · Minimal
- FEMA flood zone
- X (unshaded)
- Chance of flooding over 30 yrs
- 0.0%
- Est. flood insurance / yr
- $473 – $860
Fire risk 1/10 · Minimal
- Est. fire insurance / yr
- $717 – $1,331
Heat risk 3/10 · Minor
- Hot days now (above 101°F)
- 7 days/yr
- Hot days in 30 yrs
- 18 days/yr
Wind risk 2/10 · Minimal
- Chance of severe wind over 30 yrs
- 0.0%
Air-quality risk 4/10 · Minor
- Unhealthy air days now
- 3 days/yr
- Unhealthy air days in 30 yrs
- 5 days/yr
Risk factors via First Street. Map © Google.
Why this score? — see what drove the D grade
The composite is a weighted blend of 9 inputs, each scored 0–100. Each bar is that input's sub-score; the figure is the points it added to the 100-point composite (weight × sub-score).
- Cash flow +10.3/30.0
- ARV discount +7.5/15.0
- Schools +6.4/10.0
- Livability +4.2/5.0
- 1% rule +4.1/10.0
- Rent growth +4.1/5.0
- DSCR +3.0/10.0
- Condition / age +2.5/5.0
- Appreciation +0.0/10.0
$285,000
🖨 Deal sheet (PDF) 📄 Offer letter ✓ Due diligence
Listing remarks MLS
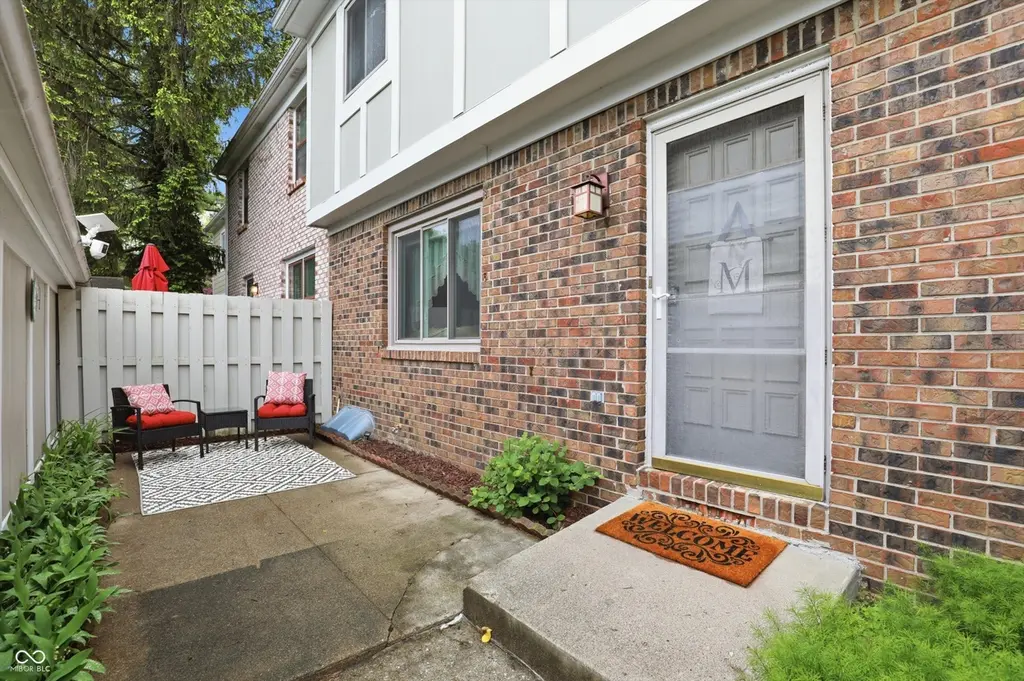
This spacious 2-story condo is located in the highly desirable Carmel Arts and Design District. The main floor features a living room, a kitchen equipped with stainless steel appliances, a dining room, and a half bath. The upper level offers 3 bedrooms and 2 full baths, providing privacy and a comfortable living space. The lower level features a family room, perfect for entertaining or relaxing. The patio with a privacy fence is a great spot for outdoor gatherings. The huge green space located directly behind the home is perfect for walking your dog or enjoying recreational activities. The home is in need of some TLC but is priced accordingly, making it a great opportunity to make it your own and add instant equity in a great location!
Key facts
- $385 HOA
- 2 garage spots
- Community pool
Property features AI
Finance
- Other: Mandatory fee ownership interest; Common walls with 2 or more adjacent units
- HOA & community: HOA with monthly fee of $385; HOA amenities include clubhouse, pool, grounds maintenance, structure maintenance, management, snow removal, trash service, and insurance
Exterior
- Parking: Detached 2-car garage (approximately 399 sq ft)
- Utilities: Public water; Municipal sewer connected; Natural gas connected; Cable available
- Home design: Residential condominium (attached); Vertical condo, ground level description; Two levels
- Construction: Brick and wood siding construction; Slab foundation
- Exterior features: Patio; No fence
Interior
- Kitchen: Electric oven; Microwave; Dishwasher; Garbage disposal; Refrigerator
- Bedrooms: Primary bedroom with walk-in closet; Three bedrooms on the upper level
- Flooring: Floor number 1
- Bathrooms: Two full bathrooms; One half bathroom; Primary bath has tub with shower
- Heating & cooling: Forced air heating (natural gas); Central air conditioning
- Interior features: Attic access; Full finished basement
- Laundry & utility: Washer and dryer included; Gas water heater; Water softener (owned)
Neighborhood map
What this means for you Summary
Snapshot
- This is a 3-bed/2.5-bath condo listed at $285k.
Deal economics
- At list price, monthly cash flow is $-156 ($-2k/yr) — negative.
- To cash-flow at today's rent, offer at most $257k (9.7% below list).
- To meet the 1% rule (rent ≥ 1% of price), the offer needs to be $259k (9.3% below list).
- Recommended offer: $257k (9.7% below list) — sets the bar for cash-flow.
- Cap rate 5.6% vs local median 2.7% in Carmel — top-decile yield for the area; either an underpriced asset or a hidden risk that comps aren't pricing in. Stress-test before assuming the spread holds.
Location & tenants
- Location reads 84/100 on livability (#7 in IN, #726 nationally) — a professional / high-income tenant draw. Strengths: crime A+, amenities A+, employment A+; Watch: commute F.
- Carmel Clay Schools (urban): math 68% / reading 70% proficiency, ranked #1 of 301 in IN (top 0%) — acceptable for families but not a draw, mixed tenant base, ~2y average lease; only 7% free/reduced lunch — higher-income household profile.
- Zoned schools: Carmel Elementary School (math 75% / reading 61%, grade B+, #49 of 994 statewide, top 5%, 624 students, 22% FRL); Carmel Middle School (math 46% / reading 61%, grade C+, #32 of 330 statewide, top 10%, 1,064 students, 20% FRL); Carmel High School (math 77% / reading 90%, grade A, #3 of 369 statewide, top 1%, 5,192 students, 13% FRL).
- Market conditions: Rents rising fast (+6.5%/yr); 346 active listings in the ZIP; 38 comparable units currently listed for rent nearby; rentals leasing fast (median 1d on market — plan ~1-2 weeks tenant-placement turnaround); high-income renter base; 4,661 units permitted in Hamilton County in 2024 (1,528 in 5+ unit buildings).
Forward outlook
- Local home prices are declining (-3.0%/yr); year-one equity from $2k of loan paydown is wiped out by about $9k of value loss. Plan a longer hold.
- Hamilton County population projected at +44% by 2050 — long-run rental-demand tailwind backs the buy-and-hold thesis.
Negotiation context
- Only 3 days on market — expect competitive offers; lowballing is unlikely to land.
- 3 sale attempts since 3y ago with the ask held roughly flat each time — persistent listings suggest the price (not the market) is what's stuck; bring a comps-based counter.
Questions for the listing agent
- What do current leases actually rent for vs. the listed asking? Can we see a recent rent roll and the last 12 months of T-12 income?
- Built in 1979 — when were the roof, HVAC, electrical panel, plumbing, and water heater last replaced?
- What does the HOA fee cover, when was the last increase, and are there any pending special assessments or reserve-fund shortfalls?
- Any open or pending special assessments — roof, HVAC, plumbing, elevator, façade? What's the per-unit balance and payoff schedule, and is the seller paying it off at close or rolling it to the buyer?
- Is there a deadline driving the sale (1031 exchange, divorce, estate, relocation)? That informs how much negotiation room exists.
- Schools are A-rated — typically a magnet for longer-tenancy family renters. What's the average tenant stay here, and is there a school-zone premium baked into asking?
- The area grade is low — what's the realistic commute time and amenity access for the typical tenant pool here? Any planned neighborhood developments (good or bad) we should know about?
- What's the average days-on-market for RENTAL listings here right now (not sales)? A rising rental-DOM trend means longer vacancies and softer asking-rent achievability than the comps imply.
- What's the recent tenant-quality profile in this submarket — average credit score on applications, eviction rate, late-payment / NSF rate, and stable-employment percentage? A property-management company in the area should have these aggregated.
- How much new apartment / multifamily construction is in the pipeline within 1–3 miles? Heavy new supply (>2% of stock underway) typically softens rents 12–24 months out; light construction supports rent growth.
Investment metrics
- 1% rule
- 0.91% ✗
- Cap rate
- 5.63%
- Cash-on-cash
- -2.35%
- DSCR
- 0.90
- GRM
- 9.2
CMA / ARV
No comps found within radius.
Projected returns pro-forma
-3.0% appreciation · 6.47% rent growth · sell at horizon
- IRR
- -15.9%
- Equity multiple
- 0.42×
- Total profit
- $-46,615
- Equity at exit
- $42,494
- IRR
- -1.8%
- Equity multiple
- 0.86×
- Total profit
- $-11,499
- Equity at exit
- $24,642
Cash invested: $79,800 (down + closing). Projections, not guarantees.
Landlord ↔ Tenant lean methodology
- Overall (STATE)
- 90 Strongly Landlord-Friendly
- State Indiana
- 90 Strongly Landlord-Friendly · R+11
- County
- — inherits STATE
- City
- — inherits STATE
ZIP-level market 46032
- Rents YoY
- 6.5%
- Active inventory
- 346
- Price-to-rent
- 9.2×
Monthly cashflow live
- Estimated rent
- $2,586 high interval (Pro) →
- Mortgage (P&I)
- −$1,495
- Tax from tax record
- −$201 /mo · $2,414/yr
- Insurance
- −$119
- HOA
- −$385
- Vacancy / Maint / Mgmt
- −$543
- Net cashflow
- $-156
Break-even live
Sensitivity live
| Price | -10% $5 | -5% $-76 | +0% $-156 | +5% $-237 | +10% $-318 |
|---|---|---|---|---|---|
| Rent | -10% $-361 | -5% $-258 | +0% $-156 | +5% $-54 | +10% $48 |
| Rate | -1.0pp $-13 | -0.5pp $-84 | base $-156 | +0.5pp $-230 | +1.0pp $-305 |
UW: 25.0% down · 7.5% · 30yr · 1.5% tax · 5.0% vac · 8.0% maint · 8.0% mgmt
Financing live
Cash to close
- Down payment
- $71,250
- Closing costs
- $8,550
- Reserves months
- —
- Total cash needed
- —
Loan-product check · same deal, 3 products live
Conventional
25% down · 7.5% · 30yr
- Down + closing
- —
- Monthly P&I
- —
- Monthly cashflow
- —
- DSCR
- —
- Eligible?
- —
Personal DTI + credit; lowest rate.
DSCR
20% down · 8.5% · 30yr
- Down + closing
- —
- Monthly P&I
- —
- Monthly cashflow
- —
- DSCR
- —
- Eligible?
- —
No personal income docs; deal must DSCR.
Hard money
10% down · 12.0% · 12mo
- Down + closing
- —
- Monthly P&I
- —
- Monthly cashflow
- —
- DSCR
- —
- Eligible?
- —
Short-term bridge; refi at stabilization.
Rent comps 38 comps
| Address | Beds | Baths | Sqft | Rent | $/sqft | DOM | Units | Dist |
|---|---|---|---|---|---|---|---|---|
| 720 S Rangeline Rd Carmel, IN | 1.0–2.0 | 1.0–2.0 | 1090 | $3,345 | $3.07 | 0d | 1 | 0.32mi |
| 110 Bryn Mawr Ln Unit T-203 Carmel, IN | 3.0 | 1.5 | 1280 | $2,199 | $1.72 | 9d | 1 | 0.32mi |
| 591 Monon Blvd Carmel, IN | 3.0 | 1.0–2.0 | 791 | $2,951 | $3.73 | 0d | 24 | 0.33mi |
| 221 E Main St Carmel, IN | 1.0–3.0 | 1.0–2.0 | 1010 | $2,099 | $2.08 | 0d | 8 | 0.34mi |
| 750 Veterans Way Carmel, IN | 1.0–3.0 | 1.0–2.5 | 1144 | $4,282 | $3.74 | 0d | 1 | 0.38mi |
| 951 Pawnee Rd Carmel, IN | 3.0 | 2.5 | 1930 | $2,575 | $1.33 | 0d | 1 | 0.43mi |
| 951 Pawnee Rd Carmel, IN | 3.0 | 2.5 | 1930 | $2,575 | $1.33 | 3d | 1 | 0.43mi |
| 537 Steinbeck Pl Carmel, IN | 3.0 | 2.5 | 1738 | $2,499 | $1.44 | 0d | 1 | 0.44mi |
| 880 Monon Green Blvd Carmel, IN | 3.0 | 1.0–2.0 | 1044 | $3,235 | $3.10 | 45d | 5 | 0.47mi |
| 1038 Valentine Ln Carmel, IN | 3.0 | 2.5 | 1755 | $2,599 | $1.48 | 9d | 1 | 0.49mi |
| 1062 Valentine Ln Carmel, IN | 3.0 | 2.5 | 1738 | $2,575 | $1.48 | 46d | 1 | 0.51mi |
| 625 Alwyne Rd Carmel, IN | 3.0 | 2.0 | 1600 | $2,750 | $1.72 | 25d | 1 | 0.53mi |
| 881 3rd Ave SW Carmel, IN | 1.0–2.0 | 1.0–2.0 | 1135 | $1,999 | $1.76 | 0d | 2 | 0.54mi |
| 400 Industrial Dr Carmel, IN | 1.0–2.0 | 1.0–2.5 | 1175 | $3,570 | $3.04 | 0d | 58 | 0.54mi |
| 25 Florence St Carmel, IN | 2.0 | 2.5 | 1338 | $2,249 | $1.68 | 12d | 1 | 0.55mi |
| 301 American Way N Carmel, IN | 1.0–3.0 | 1.0–2.0 | 1167 | $2,980 | $2.55 | 0d | 1 | 0.56mi |
| 406 W Main St #406 Carmel, IN | 2.0 | 2.0 | 1698 | $3,485 | $2.05 | 9d | 1 | 0.60mi |
| 945 Mohawk Hills Dr Carmel, IN | 1.0–3.0 | 1.0–2.5 | 1210 | $1,942 | $1.60 | 0d | 33 | 0.61mi |
| 420 W Main St Carmel, IN | 2.0 | 2.5 | 1503 | $2,950 | $1.96 | 0d | 1 | 0.62mi |
| 12656 Crescent Dr Carmel, IN | 3.0 | 2.5 | 1711 | $2,290 | $1.34 | 45d | 1 | 0.65mi |
| 358 Dartmouth St Carmel, IN | 2.0 | 2.0 | 1188 | $2,095 | $1.76 | 4d | 1 | 0.68mi |
| 675 Beacon St Carmel, IN | 1.0–3.0 | 1.0–2.5 | 1322 | $3,295 | $2.49 | 0d | 18 | 0.70mi |
| 1225 Veterans Way Carmel, IN | 1.0–2.0 | 1.0–2.0 | 926 | $2,478 | $2.68 | 0d | 11 | 0.81mi |
| 20 Wilson Dr Carmel, IN | 3.0 | 2.5 | 1728 | $3,000 | $1.74 | 12d | 1 | 0.85mi |
| 1059 Timber Creek Dr Carmel, IN | 3.0 | 2.0 | 1379 | $1,850 | $1.34 | 45d | 1 | 0.85mi |
| 12484 Breaklines St Carmel, IN | 1.0–3.0 | 1.0–2.0 | 1045 | $2,059 | $1.97 | 0d | 18 | 0.96mi |
| 1825 Jefferson Dr W Carmel, IN | 1.0–3.0 | 1.0–2.5 | 1350 | $2,575 | $1.91 | 0d | 23 | 1.06mi |
| 833 W Main St #211 Carmel, IN | 2.0 | 2.0 | 1698 | $2,985 | $1.76 | 0d | 1 | 1.08mi |
| 833 W Main St #305 Carmel, IN | 2.0 | 2.0 | 1649 | $2,950 | $1.79 | 0d | 1 | 1.08mi |
| 833 W Main St #311 Carmel, IN | 2.0 | 2.0 | 1698 | $3,130 | $1.84 | 4d | 1 | 1.08mi |
| 833 W Main St Apt 301 Carmel, IN | 2.0 | 2.0 | 1456 | $2,640 | $1.81 | 0d | 1 | 1.08mi |
| 833 W Main St Carmel, IN | 1.0–2.0 | 1.0–2.0 | 1304 | $3,485 | $2.67 | 9d | 23 | 1.08mi |
| 833 W Main St #205 Carmel, IN | 2.0 | 2.0 | 1649 | $2,785 | $1.69 | 0d | 1 | 1.08mi |
| 833 W Main St Apt 411 Carmel, IN | 2.0 | 2.0 | 1698 | $3,485 | $2.05 | 4d | 1 | 1.08mi |
| 1685 E 116th St Carmel, IN | 2.0 | 1.0–2.0 | 892 | $2,475 | $2.77 | 0d | 26 | 1.18mi |
| 947 Wickham Ct #206 Carmel, IN | 2.0 | 2.0 | 1072 | $1,650 | $1.54 | 4d | 1 | 1.29mi |
| 1111 W Main St Carmel, IN | 1.0–2.0 | 1.0–2.0 | 932 | $3,224 | $3.46 | 0d | 8 | 1.36mi |
| 300 Providence Blvd Carmel, IN | 1.0–2.0 | 1.0–2.5 | 990 | $2,045 | $2.06 | 0d | 35 | 1.39mi |
HOA detail condo
- Monthly dues
- $385 · $4,620/yr
- Assessments
- None detected in remarks — confirm with the listing agent.
Listing history 8 events
-
2026-05-04status Pending 1773-char remark
-
2026-04-30$285,000 Active 1773-char remark
-
2023-02-17soldstatus $220,000 Closed 745-char remark
Show marketing remark (745 chars)
This spacious 2-story condo is located in the highly desirable Carmel Arts and Design District. The main floor features a living room, a kitchen equipped with stainless steel appliances, a dining room, and a half bath. The upper level offers 3 bedrooms and 2 full baths, providing privacy and a comfortable living space. The lower level features a family room, perfect for entertaining or relaxing. The patio with a privacy fence is a great spot for outdoor gatherings. The huge green space located directly behind the home is perfect for walking your dog or enjoying recreational activities. The home is in need of some TLC but is priced accordingly, making it a great opportunity to make it your own and add instant equity in a great location!
-
2023-01-30status Pending 745-char remark
Show marketing remark (745 chars)
This spacious 2-story condo is located in the highly desirable Carmel Arts and Design District. The main floor features a living room, a kitchen equipped with stainless steel appliances, a dining room, and a half bath. The upper level offers 3 bedrooms and 2 full baths, providing privacy and a comfortable living space. The lower level features a family room, perfect for entertaining or relaxing. The patio with a privacy fence is a great spot for outdoor gatherings. The huge green space located directly behind the home is perfect for walking your dog or enjoying recreational activities. The home is in need of some TLC but is priced accordingly, making it a great opportunity to make it your own and add instant equity in a great location!
-
2023-01-26$225,000 Active 745-char remark
Show marketing remark (745 chars)
This spacious 2-story condo is located in the highly desirable Carmel Arts and Design District. The main floor features a living room, a kitchen equipped with stainless steel appliances, a dining room, and a half bath. The upper level offers 3 bedrooms and 2 full baths, providing privacy and a comfortable living space. The lower level features a family room, perfect for entertaining or relaxing. The patio with a privacy fence is a great spot for outdoor gatherings. The huge green space located directly behind the home is perfect for walking your dog or enjoying recreational activities. The home is in need of some TLC but is priced accordingly, making it a great opportunity to make it your own and add instant equity in a great location!
-
2023-01-11status Pending
-
2023-01-09$200,000 Active
-
2023-01-09historical
ⓘ Source: listings_history table (triggers on properties + properties_extension) + one-shot
backfill from property_details.listing_events for pre-trigger history.
Tax reassessment forecast IN · Partial reset (capped growth)
- Current annual tax
- $2,414 · $201/mo
- Projected year-2 tax
- $2,418 · $202/mo
- Expected delta
- +$4/yr ($0/mo · 0.2%)
ⓘ Screening estimate from a state-policy table — verify with the county assessor before closing.
Climate risk First Street
- Flood 1/10 Low FEMA zone X (unshaded) · 0% chance over 30 yrs
- Wildfire 1/10 Low
- Heat 3/10 Moderate 7 d/yr ≥101°F today · 18 d/yr by 30 yrs out
- Wind 2/10 Low 0% chance of damaging wind over 30 yrs
- Air quality 4/10 Moderate 3 unhealthy d/yr today · 5 by 30 yrs out
Nearby sold comps map
Loading sold comps map…
Walkable amenities ~0.75 mi
Loading nearby amenities…
Taxation est. · year 1
- Rental income
- $31,036
- − Mortgage interest
- −$15,964
- − Property taxes
- −$2,414
- − Insurance
- −$1,425
- − Repairs & maintenance
- −$2,483
- − Management
- −$2,483
- − HOA
- −$4,620
- − Depreciation
- −$8,291
- Taxable loss
- −$6,645
- Est. tax savings @ 24.0%
- +$1,595
- After-tax cash flow
- $-281/yr
For passive investors: Depreciation is non-cash, so a rental often shows a tax loss while cash-flowing — sheltering income. Rental losses are passive: they offset passive income freely, and up to $25,000/yr can offset ordinary (W-2) income if you actively participate and your MAGI is under $100k (phasing out to $0 by $150k); unused losses carry forward. On sale, claimed depreciation is recaptured at up to 25%, and gains may owe capital-gains tax (a 1031 exchange can defer both). Figures are a year-1 estimate at your 24.0% rate — not tax advice; consult a CPA.
Schools (NCES district)
- District
- Carmel Clay Schools
- NCES district ID
- 1801200
- Math proficiency
- 68% ▼ -7.00%
- Reading proficiency
- 70% ▼ -7.00%
- Median HH income
- $102,347
- Composite
- 63.54/100
- National rank
- #608
- State rank
- #1 of 301 in IN
Livability — Carmel
- Score
- 84/100
- State rank
- #7
- US rank
- #726
Category grades
Schools grade is shown separately in the Schools card above.
Census & demographics
- Census place
- Carmel, IN
- County
- Hamilton County · 337,479 people
- City population
- 99,910
- Metro
- Indianapolis-Carmel-Anderson, IN
- Population (ZIP)
- 51,515
- Household income
- $132,085
- Rent vs Own
- Severe rent burden
- 1216.0
Population outlook (Hamilton County) Hauer SSP2
- Today (2025)
- 381,938 people
- By 2030
- 417,496 · +9.3%
- By 2040
- 486,684 · +27.4%
- By 2050
- 549,805 · +44.0%
- By 2075
- 687,078 · +79.9%
- By 2100
- 754,495 · +97.5%
Race, ethnicity, and origin ACS 2023
- Neighborhood character
- Predominantly White (77%)
- Race & ethnicity
- White 77% Asian 10% Two or more races 6% Hispanic / Latino 5% Black 4%
- Hispanic origin (detail)
- Mexican 2%
- Common ancestry
- Romanian 4% Lithuanian 3% Slovak 2%
- Foreign-born
- 13% · Canada, China, South Korea
- Languages at home
- 85% English-only · Other Indo-European 4% Spanish 3% Chinese 2%
Political lean MEDSL · Hamilton
- 2024 margin
- Lean R (+6.1) · D 46.0% · R 52.1% · Other 1.9%
- 2008→2024 swing
- +16.2pp toward D · 2008: -22.2pp · 2024: -6.1pp
- All cycles
- 2024: R+6.1 2020: R+6.8 2016: R+19.6 2012: R+34.3 2008: R+22.2
Not yet ingested
- Civics
- —
Market trends
- HPI YoY
- ▼ -248.06%
- Current HPI
- 221.9087
- Rent YoY
- ▲ 6.47%
- Metro
- Indianapolis-Carmel-Anderson, IN
- State GDP YoY
- ▲ 2.90%
- F500 in state
- 18
Industry mix (Fortune 500 HQ in IN)
| Industry | F500 HQs | Revenue |
|---|---|---|
| Industrial Machinery | 2 | $37B |
|
||
| Healthcare | 1 | $177B |
|
||
| Pharmaceuticals | 1 | $45B |
|
||
| Metals / Steel | 1 | $18B |
|
||
| Agriculture | 1 | $17B |
|
||
| Packaging | 1 | $12B |
|
||
Price history
+42.5% since first listed9 events — show timeline
- 2026-06-09 Sold (MLS) $285,000 MIBOR as Distributed by MLS Grid
- 2026-05-04 Pending — MIBOR as Distributed by MLS Grid
- 2026-04-30 Listed $285,000 MIBOR as Distributed by MLS Grid
- 2023-02-17 Sold (MLS) $220,000 MIBOR as Distributed by MLS Grid
- 2023-01-30 Pending — MIBOR as Distributed by MLS Grid
- 2023-01-26 Listed $225,000 MIBOR as Distributed by MLS Grid
- 2023-01-11 Pending — MIBOR as Distributed by MLS Grid
- 2023-01-09 Listing Removed — MIBOR as Distributed by MLS Grid
- 2023-01-09 Listed $200,000 MIBOR as Distributed by MLS Grid
Property tax history
+9.9%/yrLatest (2025): $2,414 · -1.1% YoY. Source: county tax records.
Cash-flow waterfall
monthlySold comps — $/sqft
last 12 mo · ≤1 miLoading sold comps…