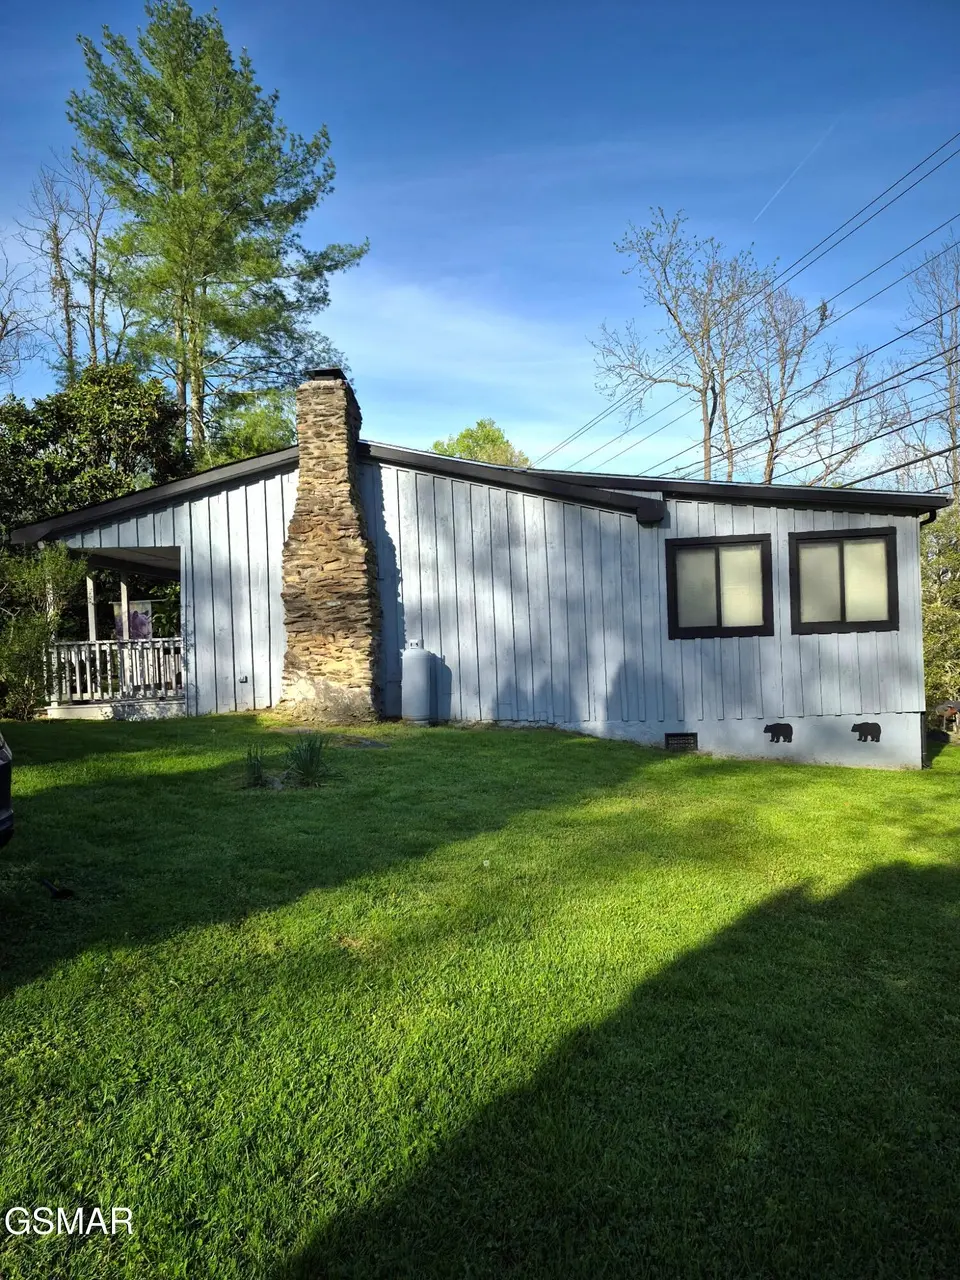
4455 Trail Hollow Rd
Cosby, TN 37722
$229,000D+
1 bd · 2.0 ba ·
792 sqft ·
Built 1900
· SingleFamily
· Active
· 70 DOM
Cashflow @ list (25.0% down · 7.5%)
Estimated rent
$1,391/mo
Mortgage (P&I)
−$1,201
Tax + insurance
−$138
HOA
−$0
Vac / Maint / Mgmt
−$292
Net cashflow
$-240/mo
Annual
$-2,883/yr
Cap rate
5.03%
Cash-on-cash
-4.50%
DSCR
0.80
1% rule
0.61%
Cash to close
$64,120
Investor read
- This is a 1-bed/2.0-bath single-family listed at $229k.
- At list price, monthly cash flow is $-240 ($-3k/yr) — negative.
- To cash-flow at today's rent, offer at most $187k (18.5% below list).
- To meet the 1% rule (rent ≥ 1% of price), the offer needs to be $139k (39.3% below list).
- It's been on market 70 days — a 6% lower offer ($215k) is reasonable based on typical stale-listing flexibility.
- Recommended offer: $139k (39.3% below list) — sets the bar for 1% rule.
- In year one you build about $24k of equity ($2k loan paydown + $23k appreciation (10.0% local appreciation)).
- Location reads: area grade D — affects rentability + tenant quality, not the cash-flow math above.
- Cocke County (rural): math 21% / reading 21% proficiency, ranked #112 of 139 in TN (top 81%) — low school quality limits family demand, transient renter base, plan for 1-2y turnover; 71% free/reduced lunch — lower-income household profile, screen leases tightly.
- Zoned schools: Smoky Mountain Elementary (math 37% / reading 27%, grade F, #369 of 952 statewide, top 42%, 178 students, 0% FRL); Cosby High School (math 8% / reading 27%, grade F, #215 of 332 statewide, top 67%, 326 students, 0% FRL) — zoned schools average 0% FRL vs 71% district-wide (71 pts lower); this property's tenant base skews higher-income than the district average.
- Watch-outs: built in 1900 — expect roof / HVAC / electrical / plumbing capex.
- Market conditions: 171 active listings in the ZIP; 13 units permitted in Cocke County in 2024 (0 in 5+ unit buildings).
- Cocke County population projected at -19% by 2050 — secular population decline; favor cash flow + early exit over multi-decade hold.
- 2 sale attempts since 10y ago with the ask held roughly flat each time — persistent listings suggest the price (not the market) is what's stuck; bring a comps-based counter.
- Current owner paid $90k; list at $229k implies a 154% gain — meaningful room to come down on a strong offer.
- By year 2, paydown + projected appreciation supports a ~$39k cash-out refi (75% LTV) — recoverable capital for the next deal without selling this one.
- Cap rate 5.0% vs local median 2.3% in Cosby — top-decile yield for the area; either an underpriced asset or a hidden risk that comps aren't pricing in. Stress-test before assuming the spread holds.
Questions for listing agent
- What do current leases actually rent for vs. the listed asking? Can we see a recent rent roll and the last 12 months of T-12 income?
- It's been on market 70 days. Have you received any prior offers? Is the seller open to a 39% concession, seller financing, or rate buy-down credit?
- Built in 1900 — when were the roof, HVAC, electrical panel, plumbing, and water heater last replaced?
- Why hasn't it sold? Are there any deal-killer items the seller is aware of (foundation, flood, title, zoning, code violations)?
- Is there a deadline driving the sale (1031 exchange, divorce, estate, relocation)? That informs how much negotiation room exists.
- The area grade is low — what's the realistic commute time and amenity access for the typical tenant pool here? Any planned neighborhood developments (good or bad) we should know about?
- What's the average days-on-market for RENTAL listings here right now (not sales)? A rising rental-DOM trend means longer vacancies and softer asking-rent achievability than the comps imply.
- What's the recent tenant-quality profile in this submarket — average credit score on applications, eviction rate, late-payment / NSF rate, and stable-employment percentage? A property-management company in the area should have these aggregated.
CashFlowRE · CFR-AF7GCQ07FTRHV6
· Data 1 day ago
cashflowre.app · 2026-05-29