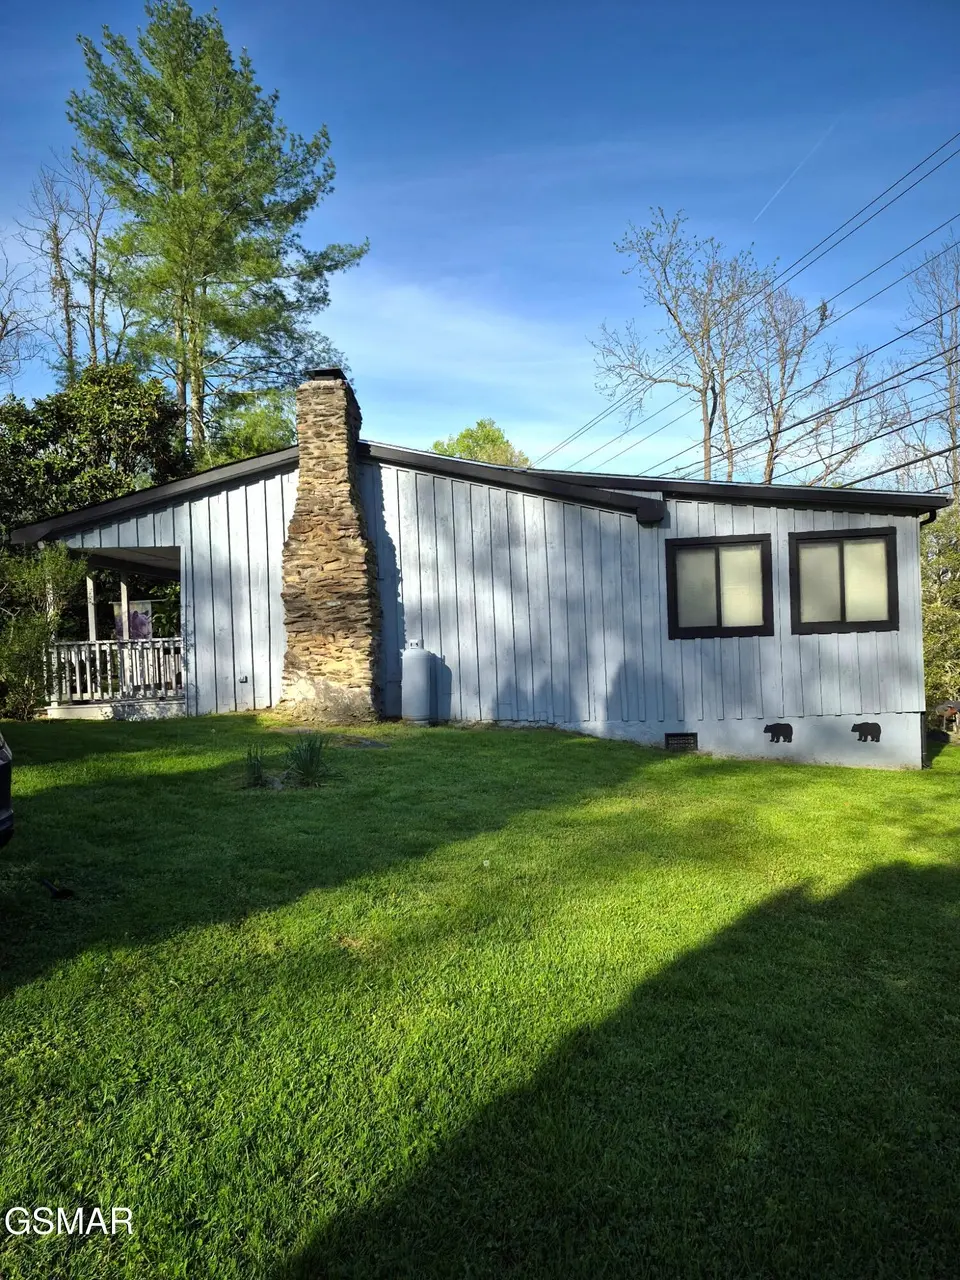
4455 Trail Hollow Rd · Cosby, TN
Flood risk 1/10 · Minimal
- FEMA flood zone
- X (unshaded)
- Chance of flooding over 30 yrs
- 0.0%
- Est. flood insurance / yr
- $507 – $1,088
Fire risk 3/10 · Minor
- Est. fire insurance / yr
- $949 – $1,763
Heat risk 4/10 · Minor
- Hot days now (above 93°F)
- 9 days/yr
- Hot days in 30 yrs
- 26 days/yr
Wind risk 2/10 · Minimal
- Chance of severe wind over 30 yrs
- —
Air-quality risk 2/10 · Minimal
- Unhealthy air days now
- 1 days/yr
- Unhealthy air days in 30 yrs
- 1 days/yr
Risk factors via First Street. Map © Google.
Why this score? — see what drove the D+ grade
The composite is a weighted blend of 9 inputs, each scored 0–100. Each bar is that input's sub-score; the figure is the points it added to the 100-point composite (weight × sub-score).
- ARV discount +15.0/15.0
- Appreciation +10.0/10.0
- Cash flow +7.9/30.0
- Rent growth +2.5/5.0
- Livability +2.5/5.0
- Condition / age +2.5/5.0
- DSCR +2.0/10.0
- Schools +1.7/10.0
- 1% rule +1.1/10.0
$229,000
🖨 Deal sheet (PDF) 📄 Offer letter ✓ Due diligence
Listing remarks MLS
Quiet mountain living in this 1 bedroom 1 bath home on almost 2 acres with a small creek that runs along the right property line. Well manicured lawn. This one is perfect for your mountain retreat. Come take in the quiet country surroundings, enjoy the sounds of the babbling creek and enjoy a place that feels like it's been waiting for you. Located in a scenic edge of Cosby with quick access to trails, the river, and the national park, this property fits buyers looking for a peaceful quiet place to call home. Schedule your showing today!
Key facts
- Well manicured lawn
- Small creek
- 1.96 acre lot
Tags
Neighborhood map
What this means for you Summary
Snapshot
- This is a 1-bed/2.0-bath single-family listed at $229k.
Deal economics
- At list price, monthly cash flow is $-240 ($-3k/yr) — negative.
- To cash-flow at today's rent, offer at most $187k (18.5% below list).
- To meet the 1% rule (rent ≥ 1% of price), the offer needs to be $139k (39.3% below list).
- Recommended offer: $139k (39.3% below list) — sets the bar for 1% rule.
- Cap rate 5.0% vs local median 2.3% in Cosby — top-decile yield for the area; either an underpriced asset or a hidden risk that comps aren't pricing in. Stress-test before assuming the spread holds.
Location & tenants
- Location reads: area grade D — affects rentability + tenant quality, not the cash-flow math above.
- Cocke County (rural): math 21% / reading 21% proficiency, ranked #112 of 139 in TN (top 81%) — low school quality limits family demand, transient renter base, plan for 1-2y turnover; 71% free/reduced lunch — lower-income household profile, screen leases tightly.
- Zoned schools: Smoky Mountain Elementary (math 37% / reading 27%, grade F, #369 of 952 statewide, top 42%, 178 students, 0% FRL); Cosby High School (math 8% / reading 27%, grade F, #215 of 332 statewide, top 67%, 326 students, 0% FRL) — zoned schools average 0% FRL vs 71% district-wide (71 pts lower); this property's tenant base skews higher-income than the district average.
- Market conditions: 171 active listings in the ZIP; 13 units permitted in Cocke County in 2024 (0 in 5+ unit buildings).
Forward outlook
- In year one you build about $24k of equity ($2k loan paydown + $23k appreciation (10.0% local appreciation)).
- Cocke County population projected at -19% by 2050 — secular population decline; favor cash flow + early exit over multi-decade hold.
- By year 2, paydown + projected appreciation supports a ~$39k cash-out refi (75% LTV) — recoverable capital for the next deal without selling this one.
Negotiation context
- It's been on market 70 days — a 6% lower offer ($215k) is reasonable based on typical stale-listing flexibility.
- 2 sale attempts since 10y ago with the ask held roughly flat each time — persistent listings suggest the price (not the market) is what's stuck; bring a comps-based counter.
- Current owner paid $90k; list at $229k implies a 154% gain — meaningful room to come down on a strong offer.
Risks & watch-outs
- Watch-outs: built in 1900 — expect roof / HVAC / electrical / plumbing capex.
Questions for the listing agent
- What do current leases actually rent for vs. the listed asking? Can we see a recent rent roll and the last 12 months of T-12 income?
- It's been on market 70 days. Have you received any prior offers? Is the seller open to a 39% concession, seller financing, or rate buy-down credit?
- Built in 1900 — when were the roof, HVAC, electrical panel, plumbing, and water heater last replaced?
- Why hasn't it sold? Are there any deal-killer items the seller is aware of (foundation, flood, title, zoning, code violations)?
- Is there a deadline driving the sale (1031 exchange, divorce, estate, relocation)? That informs how much negotiation room exists.
- The area grade is low — what's the realistic commute time and amenity access for the typical tenant pool here? Any planned neighborhood developments (good or bad) we should know about?
- What's the average days-on-market for RENTAL listings here right now (not sales)? A rising rental-DOM trend means longer vacancies and softer asking-rent achievability than the comps imply.
- What's the recent tenant-quality profile in this submarket — average credit score on applications, eviction rate, late-payment / NSF rate, and stable-employment percentage? A property-management company in the area should have these aggregated.
- How much new for-sale + rental construction is in the pipeline within 1–3 miles? Heavy new supply typically softens prices + rents 12–24 months out; constrained supply supports both.
Investment metrics
- 1% rule
- 0.61% ✗
- Cap rate
- 5.03%
- Cash-on-cash
- -4.50%
- DSCR
- 0.80
- GRM
- 13.7
CMA / ARV
- ARV (median comp)
- $306,737
- List price
- $229,000
- Delta
- -25.34%
- Verdict
- UNDERPRICED
- Comps
- 2 within 1.0 mi
Projected returns pro-forma
10.0% appreciation · 3.0% rent growth · sell at horizon
- IRR
- 21.1%
- Equity multiple
- 2.70×
- Total profit
- $109,287
- Equity at exit
- $206,301
- IRR
- 19.1%
- Equity multiple
- 6.20×
- Total profit
- $333,611
- Equity at exit
- $444,897
Cash invested: $64,120 (down + closing). Projections, not guarantees.
Landlord ↔ Tenant lean methodology
- Overall (STATE)
- 87 Strongly Landlord-Friendly
- State Tennessee
- 87 Strongly Landlord-Friendly · R+13
- County
- — inherits STATE
- City
- — inherits STATE
ZIP-level market 37722
- Home prices YoY
- 27.9%
- Active inventory
- 171
- Price-to-rent
- 13.7×
Monthly cashflow live
- Estimated rent
- $1,391 medium interval (Pro) →
- Mortgage (P&I)
- −$1,201
- Tax from tax record
- −$42 /mo · $510/yr
- Insurance
- −$95
- HOA
- −$0
- Vacancy / Maint / Mgmt
- −$292
- Net cashflow
- $-240
Break-even live
Sensitivity live
| Price | -10% $-111 | -5% $-175 | +0% $-240 | +5% $-305 | +10% $-370 |
|---|---|---|---|---|---|
| Rent | -10% $-350 | -5% $-295 | +0% $-240 | +5% $-185 | +10% $-130 |
| Rate | -1.0pp $-125 | -0.5pp $-182 | base $-240 | +0.5pp $-300 | +1.0pp $-360 |
UW: 25.0% down · 7.5% · 30yr · 1.5% tax · 5.0% vac · 8.0% maint · 8.0% mgmt
Financing live
Cash to close
- Down payment
- $57,250
- Closing costs
- $6,870
- Reserves months
- —
- Total cash needed
- —
Loan-product check · same deal, 3 products live
Conventional
25% down · 7.5% · 30yr
- Down + closing
- —
- Monthly P&I
- —
- Monthly cashflow
- —
- DSCR
- —
- Eligible?
- —
Personal DTI + credit; lowest rate.
DSCR
20% down · 8.5% · 30yr
- Down + closing
- —
- Monthly P&I
- —
- Monthly cashflow
- —
- DSCR
- —
- Eligible?
- —
No personal income docs; deal must DSCR.
Hard money
10% down · 12.0% · 12mo
- Down + closing
- —
- Monthly P&I
- —
- Monthly cashflow
- —
- DSCR
- —
- Eligible?
- —
Short-term bridge; refi at stabilization.
Listing history 22 events
-
2026-06-21days on market $229,000 Active 70 DOM
-
2026-06-19days on market $229,000 Active 68 DOM
-
2026-06-18days on market $229,000 Active 67 DOM
-
2026-06-17days on market $229,000 Active 66 DOM
-
2026-06-16days on market $229,000 Active 65 DOM
-
2026-06-15days on market $229,000 Active 64 DOM
-
2026-06-14days on market $229,000 Active 62 DOM
-
2026-06-13days on market $229,000 Active 61 DOM
-
2026-06-10days on market $229,000 Active 59 DOM
-
2026-06-09days on market $229,000 Active 58 DOM
-
2026-06-08days on market $229,000 Active 57 DOM
-
2026-06-07days on market $229,000 Active 56 DOM
-
2026-06-05days on market $229,000 Active 53 DOM
-
2026-06-02days on market $229,000 Active 51 DOM
-
2026-06-01days on market $229,000 Active 50 DOM
-
2026-05-31days on market $229,000 Active 49 DOM
-
2026-05-30days on market $229,000 Active 48 DOM
-
2026-04-13$229,000 Active 1147-char remark
Show marketing remark (1147 chars)
Quiet mountain living in this 1 bedroom 1 bath home on almost 2 acres with a small creek that runs along the right property line. Well manicured lawn. This one is perfect for your mountain retreat. Come take in the quiet country surroundings, enjoy the sounds of the babbling creek and enjoy a place that feels like it's been waiting for you. Located in a scenic edge of Cosby with quick access to trails, the river, and the national park, this property fits buyers looking for a peaceful quiet place to call home. Schedule your showing today!
-
2017-02-01soldstatus $90,100
-
2017-01-31soldstatus $90,100
-
2016-11-14soldstatus $50,000
-
2016-11-11$85,000
ⓘ Source: listings_history table (triggers on properties + properties_extension) + one-shot
backfill from property_details.listing_events for pre-trigger history.
Tax reassessment forecast TN · Resets to sale price
- Current annual tax
- $510 · $42/mo
- Projected year-2 tax
- $1,626 · $135/mo
- Expected delta
- +$1,116/yr (+$93/mo · 218.8%)
ⓘ Screening estimate from a state-policy table — verify with the county assessor before closing.
Climate risk First Street
- Flood 1/10 Low FEMA zone X (unshaded) · 0% chance over 30 yrs
- Wildfire 3/10 Moderate
- Heat 4/10 Moderate 9 d/yr ≥93°F today · 26 d/yr by 30 yrs out
- Wind 2/10 Low
- Air quality 2/10 Low 1 unhealthy d/yr today · 1 by 30 yrs out
Nearby sold comps map
Loading sold comps map…
Walkable amenities ~0.75 mi
Loading nearby amenities…
Taxation est. · year 1
- Rental income
- $16,687
- − Mortgage interest
- −$12,828
- − Property taxes
- −$510
- − Insurance
- −$1,145
- − Repairs & maintenance
- −$1,335
- − Management
- −$1,335
- − Depreciation
- −$6,662
- Taxable loss
- −$7,128
- Est. tax savings @ 24.0%
- +$1,711
- After-tax cash flow
- $-1,173/yr
For passive investors: Depreciation is non-cash, so a rental often shows a tax loss while cash-flowing — sheltering income. Rental losses are passive: they offset passive income freely, and up to $25,000/yr can offset ordinary (W-2) income if you actively participate and your MAGI is under $100k (phasing out to $0 by $150k); unused losses carry forward. On sale, claimed depreciation is recaptured at up to 25%, and gains may owe capital-gains tax (a 1031 exchange can defer both). Figures are a year-1 estimate at your 24.0% rate — not tax advice; consult a CPA.
Schools (NCES district)
- District
- Cocke County
- NCES district ID
- 4700750
- Math proficiency
- 21% ▼ -10.00%
- Reading proficiency
- 21% ▼ -10.00%
- Median HH income
- $33,486
- Composite
- 17.17/100
- National rank
- #9109
- State rank
- #112 of 139 in TN
Livability — Cosby
No livability data for this city. (Only ~50 U.S. cities are tracked.)
Census & demographics
- Population (ZIP)
- 7,430
Population outlook (Cocke County) Hauer SSP2
- Today (2025)
- 33,586 people
- By 2030
- 32,394 · -3.5%
- By 2040
- 29,727 · -11.5%
- By 2050
- 27,075 · -19.4%
- By 2075
- 22,590 · -32.7%
- By 2100
- 19,643 · -41.5%
Race, ethnicity, and origin ACS 2023
- Neighborhood character
- Predominantly White (91%)
- Race & ethnicity
- White 91% Hispanic / Latino 6% Two or more races 4% Native American 2%
- Hispanic origin (detail)
- Puerto Rican 1% Cuban 1%
- Common ancestry
- Slovak 5% Romanian 1% Iranian 1%
- Foreign-born
- 4% · Canada, Guatemala, China
- Languages at home
- 95% English-only · Spanish 4%
Political lean MEDSL · Cocke
- 2024 margin
- Solid R (+68.2) · D 15.4% · R 83.7%
- 2008→2024 swing
- -23.3pp toward R · 2008: -44.9pp · 2024: -68.2pp
- All cycles
- 2024: R+68.2 2020: R+64.8 2016: R+64.5 2012: R+49.4 2008: R+44.9
Not yet ingested
- Civics
- —
Market trends
- HPI YoY
- ▲ 85.12%
- Current HPI
- 390.2959
- Rent YoY
- —
- Metro
- —
- State GDP YoY
- ▲ 2.78%
- F500 in state
- 22
Industry mix (Fortune 500 HQ in TN)
| Industry | F500 HQs | Revenue |
|---|---|---|
| Healthcare | 3 | $91B |
|
||
| Retail | 3 | $72B |
|
||
| Transportation / Logistics | 1 | $88B |
|
||
| Paper / Packaging | 1 | $19B |
|
||
| Insurance | 1 | $13B |
|
||
| Energy | 1 | $12B |
|
||
Price history
+169.4% since first listed5 events — show timeline
- 2026-04-13 Listed $229,000 GSMAR
- 2017-02-01 Sold (Public Records) $90,100 Public Records
- 2017-01-31 Sold (MLS) $90,100 LAAR
- 2016-11-14 Sold (Public Records) $50,000 Public Records
- 2016-11-11 Listed $85,000 LAAR
Property tax history
+3.3%/yrLatest (2025): $510 · +56.0% YoY. Source: county tax records.
Cash-flow waterfall
monthlySold comps — $/sqft
last 12 mo · ≤1 miLoading sold comps…