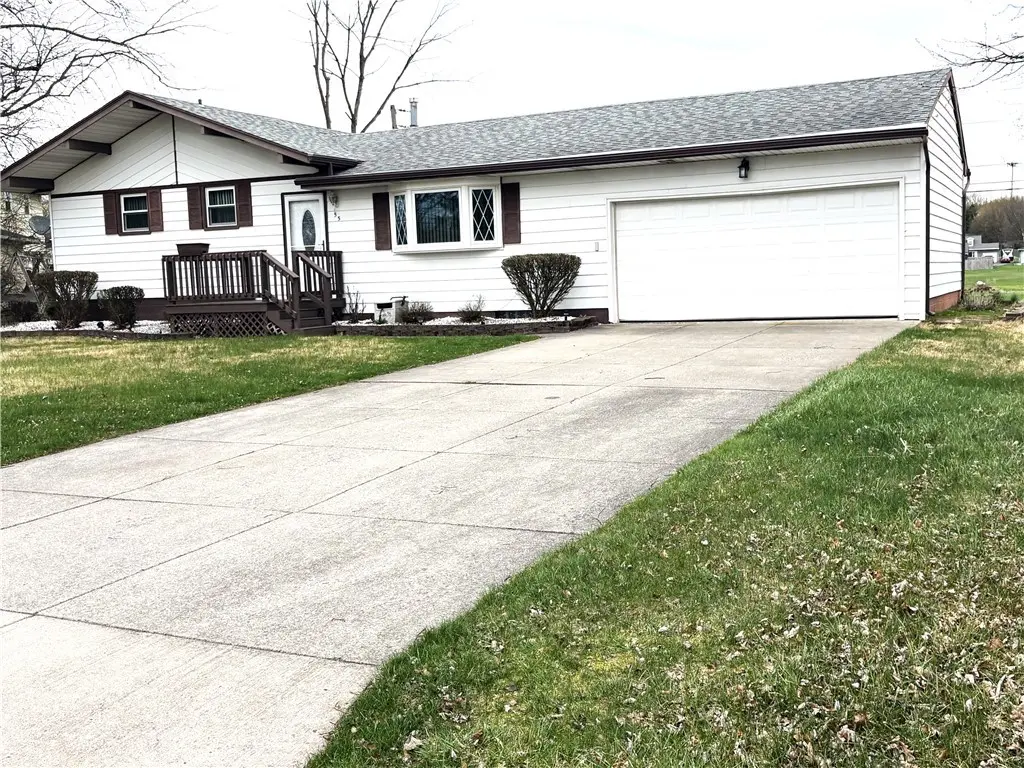
55 Galway Dr
Rochester Institute of Technology, NY 14623
$219,900C-
3 bd · 1.0 ba ·
1,050 sqft ·
Built 1966
· SingleFamily
· Pending
· 7 DOM
Cashflow @ list (25.0% down · 7.5%)
Estimated rent
$2,299/mo
Mortgage (P&I)
−$1,153
Tax + insurance
−$478
HOA
−$0
Vac / Maint / Mgmt
−$483
Net cashflow
$185/mo
Annual
$2,217/yr
Cap rate
7.30%
Cash-on-cash
3.60%
DSCR
1.16
1% rule
1.05%
Cash to close
$61,572
Investor read
- This is a 3-bed/1.0-bath single-family listed at $220k.
- At list price, monthly cash flow is $185 ($2k/yr) — positive.
- The deal already cash-flows at list — no discount required.
- Meets the 1% rule at list price ($2k rent vs $220k).
- Only 7 days on market — expect competitive offers; lowballing is unlikely to land.
- Local home prices are declining (-3.0%/yr); year-one equity from $2k of loan paydown is wiped out by about $7k of value loss. Plan a longer hold.
- Location reads: area grade C — affects rentability + tenant quality, not the cash-flow math above.
- Rush-Henrietta Central School District (suburban): math 62% / reading 57% proficiency, ranked #237 of 590 in NY (top 40%) — acceptable for families but not a draw, mixed tenant base, ~2y average lease.
- Zoned schools: Ethel K Fyle Elementary School (math 74% / reading 64%, grade A-, #447 of 2,108 statewide, top 24%, 424 students, 55% FRL); Henry V Burger Junior High School (math 48% / reading 56%, grade C+, #241 of 729 statewide, top 35%, 691 students, 43% FRL); Rush-Henrietta Senior High School (math 97% / reading 72%, grade A, #379 of 1,100 statewide, top 36%, 1,300 students, 43% FRL) — zoned schools average 47% FRL vs 29% district-wide (18 pts higher); higher-poverty schools than district average — tighter screening recommended.
- Market conditions: Rents rising fast (+6.1%/yr); 49 active listings in the ZIP; 3 comparable units currently listed for rent nearby; rentals leasing fast (median 5d on market — plan ~1-2 weeks tenant-placement turnaround); 1,169 units permitted in Monroe County in 2024 (591 in 5+ unit buildings).
- Monroe County population projected to shrink 6% by 2050 — rents likely to lag national; underwrite the cash flow, not the appreciation.
- Cap rate 7.3% vs local median 3.9% in Rochester Institute of Technology — top-decile yield for the area; either an underpriced asset or a hidden risk that comps aren't pricing in. Stress-test before assuming the spread holds.
- This rent runs 42% of the median local income ($65k/yr) — at the standard rent-burdened threshold; future hikes will face affordability resistance.
Questions for listing agent
- Built in 1966 — when were the roof, HVAC, electrical panel, plumbing, and water heater last replaced?
- Is there a deadline driving the sale (1031 exchange, divorce, estate, relocation)? That informs how much negotiation room exists.
- What's the average days-on-market for RENTAL listings here right now (not sales)? A rising rental-DOM trend means longer vacancies and softer asking-rent achievability than the comps imply.
- What's the recent tenant-quality profile in this submarket — average credit score on applications, eviction rate, late-payment / NSF rate, and stable-employment percentage? A property-management company in the area should have these aggregated.
- How much new for-sale + rental construction is in the pipeline within 1–3 miles? Heavy new supply typically softens prices + rents 12–24 months out; constrained supply supports both.
CashFlowRE · CFR-AGGNNZ4PGVY8HY
· Data 4 weeks ago
cashflowre.app · 2026-05-29