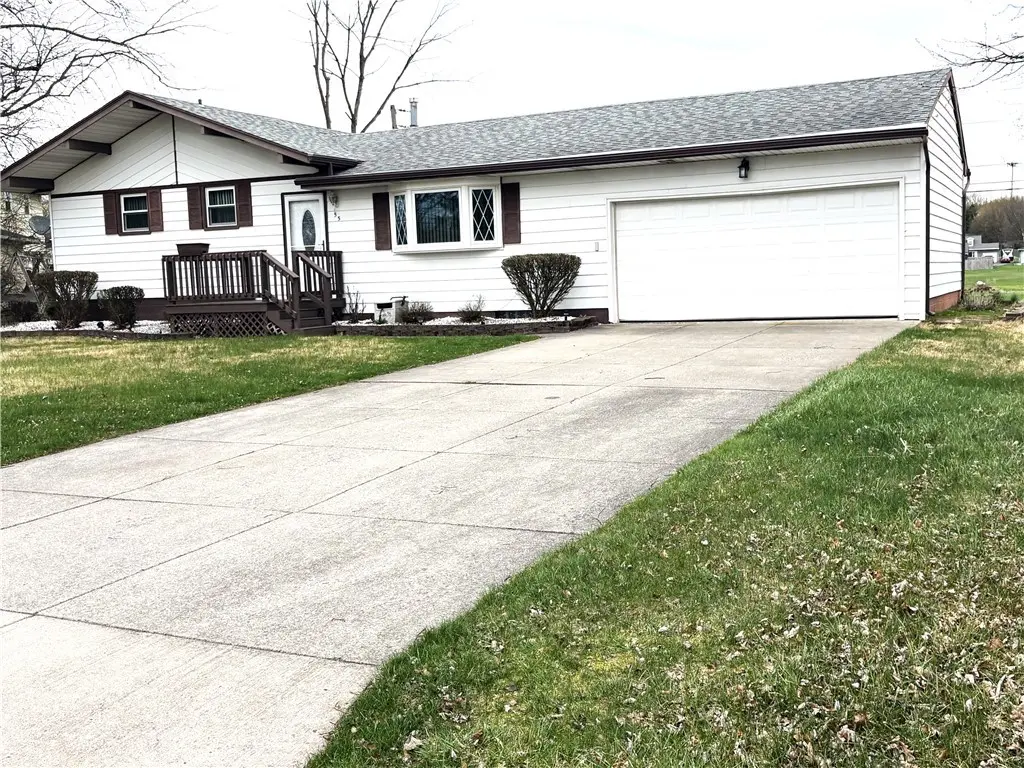
55 Galway Dr · Rochester Institute of Technology, NY
Flood risk 1/10 · Minimal
- FEMA flood zone
- X (unshaded)
- Chance of flooding over 30 yrs
- 0.0%
- Est. flood insurance / yr
- $473 – $860
Fire risk 2/10 · Minimal
- Est. fire insurance / yr
- $691 – $1,283
Heat risk 2/10 · Minimal
- Hot days now (above 94°F)
- 7 days/yr
- Hot days in 30 yrs
- 15 days/yr
Wind risk 1/10 · Minimal
- Chance of severe wind over 30 yrs
- —
Air-quality risk 2/10 · Minimal
- Unhealthy air days now
- 1 days/yr
- Unhealthy air days in 30 yrs
- 1 days/yr
Risk factors via First Street. Map © Google.
Why this score? — see what drove the C- grade
The composite is a weighted blend of 9 inputs, each scored 0–100. Each bar is that input's sub-score; the figure is the points it added to the 100-point composite (weight × sub-score).
- Cash flow +17.9/30.0
- ARV discount +11.3/15.0
- DSCR +5.6/10.0
- 1% rule +5.5/10.0
- Schools +5.2/10.0
- Rent growth +4.0/5.0
- Livability +2.5/5.0
- Condition / age +2.5/5.0
- Appreciation +0.0/10.0
$219,900
🖨 Deal sheet (PDF) 📄 Offer letter ✓ Due diligence
Listing remarks
Great investment opportunity! Rare find split ranch style home in a popular neighborhood! Estate Sale so no PCD available / Appliances currently on the property can remain with no warranties / Property to be sold 'as-is' / Delayed Negotiations due Thursday April 23 at 6 pm
Key facts
- 9,600 sq ft lot
- 2 garage spots
- Built 1966
Neighborhood map
What this means for you Summary
Snapshot
- This is a 3-bed/1.0-bath single-family listed at $220k.
Deal economics
- At list price, monthly cash flow is $185 ($2k/yr) — positive.
- The deal already cash-flows at list — no discount required.
- Meets the 1% rule at list price ($2k rent vs $220k).
- Cap rate 7.3% vs local median 3.8% in Rochester Institute of Technology — top-decile yield for the area; either an underpriced asset or a hidden risk that comps aren't pricing in. Stress-test before assuming the spread holds.
Location & tenants
- Location reads: area grade C — affects rentability + tenant quality, not the cash-flow math above.
- Rush-Henrietta Central School District (suburban): math 62% / reading 57% proficiency, ranked #237 of 590 in NY (top 40%) — acceptable for families but not a draw, mixed tenant base, ~2y average lease.
- Zoned schools: Ethel K Fyle Elementary School (math 74% / reading 64%, grade A-, #447 of 2,108 statewide, top 24%, 424 students, 55% FRL); Henry V Burger Junior High School (math 48% / reading 56%, grade C+, #241 of 729 statewide, top 35%, 691 students, 43% FRL); Rush-Henrietta Senior High School (math 97% / reading 72%, grade A, #379 of 1,100 statewide, top 36%, 1,300 students, 43% FRL) — zoned schools average 47% FRL vs 29% district-wide (18 pts higher); higher-poverty schools than district average — tighter screening recommended.
- Market conditions: Rents rising fast (+6.1%/yr); 49 active listings in the ZIP; 3 comparable units currently listed for rent nearby; rentals leasing fast (median 5d on market — plan ~1-2 weeks tenant-placement turnaround); 1,169 units permitted in Monroe County in 2024 (591 in 5+ unit buildings).
- This rent runs 42% of the median local income ($65k/yr) — at the standard rent-burdened threshold; future hikes will face affordability resistance.
Forward outlook
- Local home prices are declining (-3.0%/yr); year-one equity from $2k of loan paydown is wiped out by about $7k of value loss. Plan a longer hold.
- Monroe County population projected to shrink 6% by 2050 — rents likely to lag national; underwrite the cash flow, not the appreciation.
Negotiation context
- Only 7 days on market — expect competitive offers; lowballing is unlikely to land.
Questions for the listing agent
- Built in 1966 — when were the roof, HVAC, electrical panel, plumbing, and water heater last replaced?
- Is there a deadline driving the sale (1031 exchange, divorce, estate, relocation)? That informs how much negotiation room exists.
- What's the average days-on-market for RENTAL listings here right now (not sales)? A rising rental-DOM trend means longer vacancies and softer asking-rent achievability than the comps imply.
- What's the recent tenant-quality profile in this submarket — average credit score on applications, eviction rate, late-payment / NSF rate, and stable-employment percentage? A property-management company in the area should have these aggregated.
- How much new for-sale + rental construction is in the pipeline within 1–3 miles? Heavy new supply typically softens prices + rents 12–24 months out; constrained supply supports both.
Investment metrics
- 1% rule
- 1.05% ✓
- Cap rate
- 7.30%
- Cash-on-cash
- 3.60%
- DSCR
- 1.16
- GRM
- 8.0
CMA / ARV
- ARV (on-the-fly)
- $240,450
- Comps found
- 11
Show comp detail 11 sales within ~0.75 mi
| Address | Dist | Beds/Ba | Sqft | Sold | Price | $/sf | Match |
|---|---|---|---|---|---|---|---|
| 55 Galway Dr | 0.00mi | 3/1.0 | 1,050 (0%) | 0mo | $226,250 | $215 | 100 |
| 73 Campus Dr | 0.31mi | 3/1.0 | 1,050 (0%) | 9mo | $250,000 | $238 | 78 |
| 139 Cattaragus Dr | 0.13mi | 3/1.5 | 1,050 (0%) | 22mo | $277,500 | $264 | 73 |
| 65 Post Hill Dr | 0.19mi | 3/1.5 | 1,050 (0%) | 20mo | $260,000 | $248 | 73 |
| 220 Vollmer Pkwy | 0.19mi | 3/2.0 | 1,050 (0%) | 20mo | $280,000 | $267 | 71 |
| 12 Post Hill Dr | 0.30mi | 3/1.0 | 1,050 (0%) | 20mo | $185,000 | $176 | 70 |
| 56 Beckwith Rd | 0.38mi | 3/1.5 | 1,050 (0%) | 18mo | $216,000 | $206 | 65 |
| 56 Parkerhouse Rd | 0.30mi | 3/2.0 | 1,050 (0%) | 22mo | $240,000 | $229 | 64 |
| 24 Blueberry Cres | 0.25mi | 3/1.0 | 986 (-6%) | 21mo | $181,500 | $184 | 61 |
| 51 Friel Rd | 0.45mi | 2/2.0 (-1) | 1,050 (0%) | 13mo | $271,000 | $258 | 59 |
| 679 Bailey Rd | 0.44mi | 3/2.0 | 1,050 (0%) | 24mo | $225,000 | $214 | 56 |
Match score weights: distance 35% · size 25% · config 20% · recency 20%. Top-matched comps best support the ARV.
Projected returns pro-forma
-3.0% appreciation · 6.06% rent growth · sell at horizon
- IRR
- -7.0%
- Equity multiple
- 0.73×
- Total profit
- $-16,468
- Equity at exit
- $32,788
- IRR
- 6.3%
- Equity multiple
- 1.54×
- Total profit
- $33,112
- Equity at exit
- $19,013
Cash invested: $61,572 (down + closing). Projections, not guarantees.
Landlord ↔ Tenant lean methodology
- Overall (STATE)
- 15 Strongly Tenant-Friendly
- State New York
- 15 Strongly Tenant-Friendly · D+10
- County
- — inherits STATE
- City
- — inherits STATE
ZIP-level market 14623
- Rents YoY
- 6.1%
- Active inventory
- 49
- Price-to-rent
- 8.0×
Monthly cashflow live
- Estimated rent
- $2,299 medium interval (Pro) →
- Mortgage (P&I)
- −$1,153
- Tax from tax record
- −$387 /mo · $4,642/yr
- Insurance
- −$92
- HOA
- −$0
- Lot rent
- −$0
- Vacancy / Maint / Mgmt
- −$483
- Net cashflow
- $185
Break-even live
Sensitivity live
| Price | -10% $309 | -5% $247 | +0% $185 | +5% $123 | +10% $60 |
|---|---|---|---|---|---|
| Rent | -10% $3 | -5% $94 | +0% $185 | +5% $276 | +10% $366 |
| Rate | -1.0pp $295 | -0.5pp $241 | base $185 | +0.5pp $128 | +1.0pp $70 |
UW: 25.0% down · 7.5% · 30yr · 1.5% tax · 5.0% vac · 8.0% maint · 8.0% mgmt
Financing live
Cash to close
- Down payment
- $54,975
- Closing costs
- $6,597
- Reserves months
- —
- Total cash needed
- —
Loan-product check · same deal, 3 products live
Conventional
25% down · 7.5% · 30yr
- Down + closing
- —
- Monthly P&I
- —
- Monthly cashflow
- —
- DSCR
- —
- Eligible?
- —
Personal DTI + credit; lowest rate.
DSCR
20% down · 8.5% · 30yr
- Down + closing
- —
- Monthly P&I
- —
- Monthly cashflow
- —
- DSCR
- —
- Eligible?
- —
No personal income docs; deal must DSCR.
Hard money
10% down · 12.0% · 12mo
- Down + closing
- —
- Monthly P&I
- —
- Monthly cashflow
- —
- DSCR
- —
- Eligible?
- —
Short-term bridge; refi at stabilization.
Rent comps 3 comps
| Address | Beds | Baths | Sqft | Rent | $/sqft | DOM | Units | Dist |
|---|---|---|---|---|---|---|---|---|
| 58 Campus Dr Rochester, NY | 3.0 | 1.5 | 1253 | $2,200 | $1.76 | 46d | 1 | 0.25mi |
| 340 Bennington Hills Ct West Henrietta, NY | 1.0–3.0 | 1.0–2.0 | 970 | $2,007 | $2.07 | 5d | 5 | 0.58mi |
| 6 Loden Ln Rochester, NY | 3.0 | 1.0–1.5 | 867 | $2,135 | $2.46 | 5d | 10 | 0.83mi |
Listing history 2 events
-
2026-04-25status Pending
-
2026-04-17$219,900 Active
ⓘ Source: listings_history table (triggers on properties + properties_extension) + one-shot
backfill from property_details.listing_events for pre-trigger history.
Tax reassessment forecast NY · Partial reset (capped growth)
- Current annual tax
- $4,642 · $387/mo
- Projected year-2 tax
- $4,642 · $387/mo
- Expected delta
- $0/yr ($0/mo · 0.0%)
ⓘ Screening estimate from a state-policy table — verify with the county assessor before closing.
Climate risk First Street
- Flood 1/10 Low FEMA zone X (unshaded) · 0% chance over 30 yrs
- Wildfire 2/10 Low
- Heat 2/10 Low 7 d/yr ≥94°F today · 15 d/yr by 30 yrs out
- Wind 1/10 Low
- Air quality 2/10 Low 1 unhealthy d/yr today · 1 by 30 yrs out
Nearby sold comps map
Loading sold comps map…
Walkable amenities ~0.75 mi
Loading nearby amenities…
Taxation est. · year 1
- Rental income
- $27,590
- − Mortgage interest
- −$12,318
- − Property taxes
- −$4,642
- − Insurance
- −$1,100
- − Repairs & maintenance
- −$2,207
- − Management
- −$2,207
- − Depreciation
- −$6,397
- Taxable loss
- −$1,280
- Est. tax savings @ 24.0%
- +$307
- After-tax cash flow
- $2,524/yr
For passive investors: Depreciation is non-cash, so a rental often shows a tax loss while cash-flowing — sheltering income. Rental losses are passive: they offset passive income freely, and up to $25,000/yr can offset ordinary (W-2) income if you actively participate and your MAGI is under $100k (phasing out to $0 by $150k); unused losses carry forward. On sale, claimed depreciation is recaptured at up to 25%, and gains may owe capital-gains tax (a 1031 exchange can defer both). Figures are a year-1 estimate at your 24.0% rate — not tax advice; consult a CPA.
Schools (NCES district)
- District
- Rush-Henrietta Central School District
- NCES district ID
- 3625170
- Math proficiency
- 62% ▼ -6.00%
- Reading proficiency
- 57% ▲ 1.00%
- Median HH income
- $58,682
- Composite
- 51.52/100
- National rank
- #1720
- State rank
- #237 of 590 in NY
Livability — Rochester Institute of Technology
No livability data for this city. (Only ~50 U.S. cities are tracked.)
Census & demographics
- County
- Monroe County · 674,131 people
- Metro
- Rochester, NY
- Population (ZIP)
- 26,032
- Household income
- $65,342
- Rent vs Own
- Severe rent burden
- 1161.0
Population outlook (Monroe County) Hauer SSP2
- Today (2025)
- 759,460 people
- By 2030
- 757,154 · -0.3%
- By 2040
- 740,644 · -2.5%
- By 2050
- 714,443 · -5.9%
- By 2075
- 645,883 · -15.0%
- By 2100
- 547,084 · -28.0%
Race, ethnicity, and origin ACS 2023
- Neighborhood character
- Predominantly White (67%)
- Race & ethnicity
- White 67% Asian 15% Black 8% Two or more races 6% Hispanic / Latino 6%
- Hispanic origin (detail)
- Puerto Rican 3%
- Common ancestry
- Romanian 4% Iranian 2% Lithuanian 2%
- Foreign-born
- 14% · China, Canada, Vietnam
- Languages at home
- 84% English-only · Chinese 4% Other Indo-European 3% Spanish 2%
Political lean MEDSL · Monroe
- 2024 margin
- D (+19.1) · D 59.5% · R 40.5%
- 2008→2024 swing
- +1.4pp toward D · 2008: 17.7pp · 2024: 19.1pp
- All cycles
- 2024: D+19.1 2020: D+21.0 2016: D+14.1 2012: D+17.4 2008: D+17.7
Not yet ingested
- Civics
- —
Market trends
- HPI YoY
- ▼ -180.68%
- Current HPI
- 262.8187
- Rent YoY
- ▲ 6.06%
- Metro
- Rochester, NY
- State GDP YoY
- ▲ 2.60%
- F500 in state
- 92
Industry mix (Fortune 500 HQ in NY)
| Industry | F500 HQs | Revenue |
|---|---|---|
| Financial Services | 10 | $950B |
|
||
| Consumer Goods | 9 | $162B |
|
||
| Insurance | 4 | $225B |
|
||
| Telecommunications | 2 | $144B |
|
||
| Pharmaceuticals | 2 | $112B |
|
||
| Media / Entertainment | 2 | $69B |
|
||
Price history
2 events — show timeline
- 2026-04-25 Pending — UNYREIS
- 2026-04-17 Listed $219,900 UNYREIS
Property tax history
+5.6%/yrLatest (2025): $4,642 · +85.3% YoY. Source: county tax records.
Cash-flow waterfall
monthlySold comps — $/sqft
last 12 mo · ≤1 miLoading sold comps…