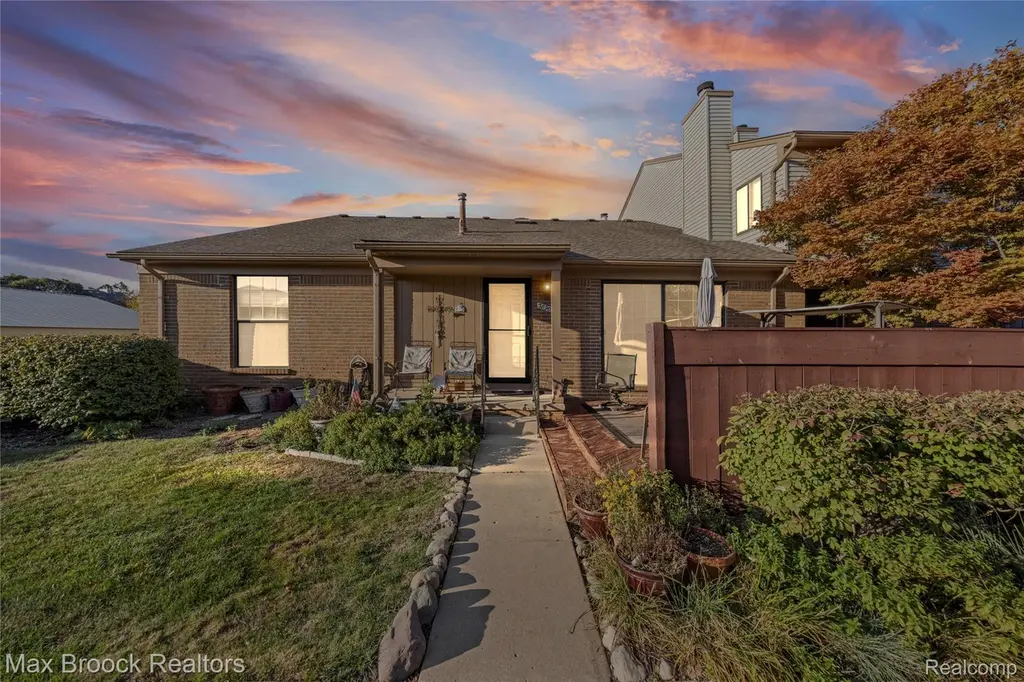
38903 Country Cir
Farmington Hills, MI 48331
$220,000D
2 bd · 2.0 ba ·
1,845 sqft ·
Built 1985
· Condo
· Active
· 8 DOM
Cashflow @ list (25.0% down · 7.5%)
Estimated rent
$2,202/mo
Mortgage (P&I)
−$1,154
Tax + insurance
−$325
HOA
−$400
Vac / Maint / Mgmt
−$462
Net cashflow
$-139/mo
Annual
$-1,670/yr
Cap rate
5.53%
Cash-on-cash
-2.71%
DSCR
0.88
1% rule
1.00%
Cash to close
$61,600
Investor read
- This is a 2-bed/2.0-bath condo listed at $220k.
- At list price, monthly cash flow is $-139 ($-2k/yr) — negative.
- To cash-flow at today's rent, offer at most $195k (11.2% below list).
- Meets the 1% rule at list price ($2k rent vs $220k).
- Only 8 days on market — expect competitive offers; lowballing is unlikely to land.
- Recommended offer: $195k (11.2% below list) — sets the bar for cash-flow.
- Local home prices are declining (-3.0%/yr); year-one equity from $2k of loan paydown is wiped out by about $7k of value loss. Plan a longer hold.
- Location reads 81/100 on livability (#64 in MI, #1,364 nationally) — a professional / high-income tenant draw. Strengths: employment A+, housing A+, crime A; Watch: amenities D, health & safety F.
- Walled Lake Consolidated Schools (suburban): math 52% / reading 60% proficiency, ranked #58 of 540 in MI (top 11%) — acceptable for families but not a draw, mixed tenant base, ~2y average lease; only 20% free/reduced lunch — higher-income household profile.
- Market conditions: Rents rising fast (+9.7%/yr); 87 active listings in the ZIP; 7 comparable units currently listed for rent nearby; rentals leasing fast (median 2d on market — plan ~1-2 weeks tenant-placement turnaround); high-income renter base; 2,614 units permitted in Oakland County in 2024 (721 in 5+ unit buildings).
- Oakland County population projected at +10% by 2050 — modest demand growth; plan on rents tracking national, not racing it.
- 6 sale attempts since 12y ago; this cycle's ask has dropped $20k (8%) from the opening price — seller is motivated, your offer sets the floor, not the list.
- Current owner paid $115k; list at $220k implies a 91% gain — meaningful room to come down on a strong offer.
- Cap rate 5.5% vs local median 3.5% in Farmington Hills — top-decile yield for the area; either an underpriced asset or a hidden risk that comps aren't pricing in. Stress-test before assuming the spread holds.
Questions for listing agent
- What do current leases actually rent for vs. the listed asking? Can we see a recent rent roll and the last 12 months of T-12 income?
- What does the HOA fee cover, when was the last increase, and are there any pending special assessments or reserve-fund shortfalls?
- Any open or pending special assessments — roof, HVAC, plumbing, elevator, façade? What's the per-unit balance and payoff schedule, and is the seller paying it off at close or rolling it to the buyer?
- Is there a deadline driving the sale (1031 exchange, divorce, estate, relocation)? That informs how much negotiation room exists.
- Schools are B-rated — typically a magnet for longer-tenancy family renters. What's the average tenant stay here, and is there a school-zone premium baked into asking?
- The area grade is low — what's the realistic commute time and amenity access for the typical tenant pool here? Any planned neighborhood developments (good or bad) we should know about?
- What's the average days-on-market for RENTAL listings here right now (not sales)? A rising rental-DOM trend means longer vacancies and softer asking-rent achievability than the comps imply.
- What's the recent tenant-quality profile in this submarket — average credit score on applications, eviction rate, late-payment / NSF rate, and stable-employment percentage? A property-management company in the area should have these aggregated.
CashFlowRE · CFR-AGJJC71B538YHT
· Data 2 days ago
cashflowre.app · 2026-05-29