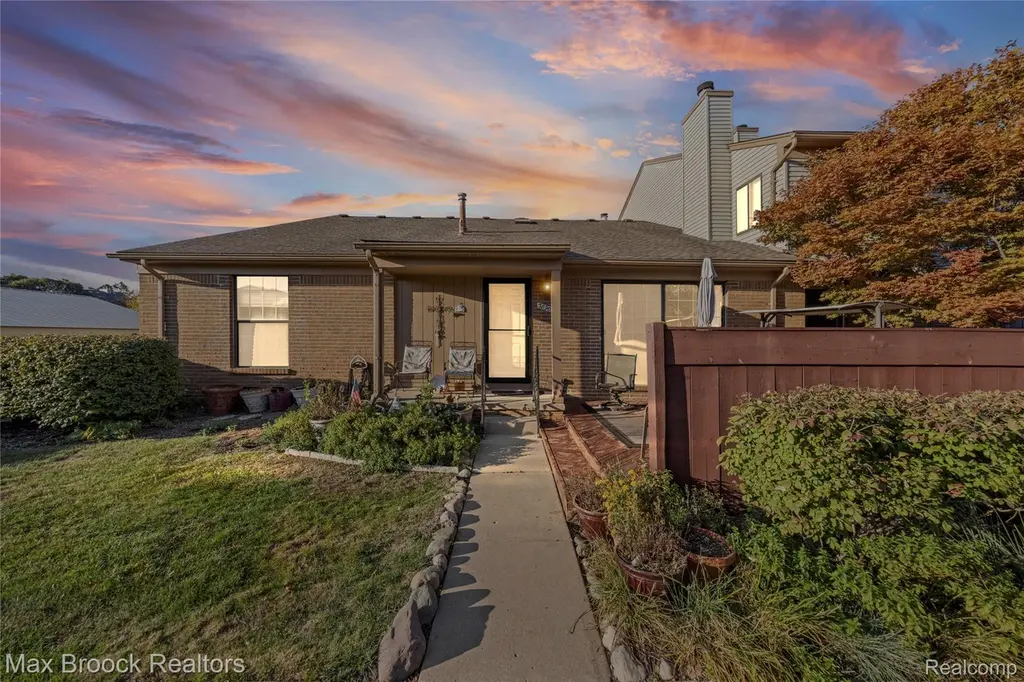
38903 Country Cir · Farmington Hills, MI
Flood risk 1/10 · Minimal
- FEMA flood zone
- X (unshaded)
- Chance of flooding over 30 yrs
- 0.0%
- Est. flood insurance / yr
- $473 – $860
Fire risk 1/10 · Minimal
- Est. fire insurance / yr
- $784 – $1,456
Heat risk 2/10 · Minimal
- Hot days now (above 96°F)
- 7 days/yr
- Hot days in 30 yrs
- 15 days/yr
Wind risk 2/10 · Minimal
- Chance of severe wind over 30 yrs
- —
Air-quality risk 3/10 · Minor
- Unhealthy air days now
- 2 days/yr
- Unhealthy air days in 30 yrs
- 4 days/yr
Risk factors via First Street. Map © Google.
Why this score? — see what drove the D grade
The composite is a weighted blend of 9 inputs, each scored 0–100. Each bar is that input's sub-score; the figure is the points it added to the 100-point composite (weight × sub-score).
- Cash flow +9.8/30.0
- ARV discount +6.7/15.0
- 1% rule +5.0/10.0
- Schools +5.0/10.0
- Rent growth +4.9/5.0
- Livability +4.0/5.0
- DSCR +2.8/10.0
- Condition / age +2.5/5.0
- Appreciation +0.0/10.0
$220,000
🖨 Deal sheet 📄 Offer letter ✓ Due diligence
Listing remarks MLS
Rare Opportunity! Beautiful GROUND LEVEL END-UNIT RANCH CONDO with a finished basement, private patio, and attached garage, located in the highly desirable Crosswinds of Farmington Hills community. Residents enjoy fantastic amenities including a sparkling pool, tennis courts, and beautifully landscaped grounds. Step into a welcoming foyer with ceramic flooring that opens to a spacious great room featuring a vaulted ceiling, a cozy fireplace, and a doorwall leading to a private deck - perfect for relaxing or entertaining. The dining area also showcases a vaulted ceiling and flows seamlessly into the bright kitchen, complete with a skylight and included appliances. The generous primary suite offers a vaulted ceiling and a private bath designed for comfort and convenience. The finished basement provides additional living space with a large family/recreation room, along with a laundry and utility area, offering excellent storage. Enjoy the ease of maintenance-free living in a prime location close to shopping, dining, and major expressways.
Key facts
- Attached garage
- Landscaped grounds
- Tennis courts
Tags
Neighborhood map
What this means for you Summary
Snapshot
- This is a 2-bed/2.0-bath condo listed at $220k.
Deal economics
- At list price, monthly cash flow is $-139 ($-2k/yr) — negative.
- To cash-flow at today's rent, offer at most $195k (11.2% below list).
- Meets the 1% rule at list price ($2k rent vs $220k).
- Recommended offer: $195k (11.2% below list) — sets the bar for cash-flow.
- Cap rate 5.5% vs local median 3.5% in Farmington Hills — top-decile yield for the area; either an underpriced asset or a hidden risk that comps aren't pricing in. Stress-test before assuming the spread holds.
Location & tenants
- Location reads 81/100 on livability (#64 in MI, #1,364 nationally) — a professional / high-income tenant draw. Strengths: employment A+, housing A+, crime A; Watch: amenities D, health & safety F.
- Walled Lake Consolidated Schools (suburban): math 52% / reading 60% proficiency, ranked #58 of 540 in MI (top 11%) — acceptable for families but not a draw, mixed tenant base, ~2y average lease; only 20% free/reduced lunch — higher-income household profile.
- Market conditions: Rents rising fast (+9.7%/yr); 87 active listings in the ZIP; 7 comparable units currently listed for rent nearby; rentals leasing fast (median 2d on market — plan ~1-2 weeks tenant-placement turnaround); high-income renter base; 2,614 units permitted in Oakland County in 2024 (721 in 5+ unit buildings).
Forward outlook
- Local home prices are declining (-3.0%/yr); year-one equity from $2k of loan paydown is wiped out by about $7k of value loss. Plan a longer hold.
- Oakland County population projected at +10% by 2050 — modest demand growth; plan on rents tracking national, not racing it.
Negotiation context
- Only 8 days on market — expect competitive offers; lowballing is unlikely to land.
- 6 sale attempts since 12y ago; this cycle's ask has dropped $20k (8%) from the opening price — seller is motivated, your offer sets the floor, not the list.
- Current owner paid $115k; list at $220k implies a 91% gain — meaningful room to come down on a strong offer.
Questions for the listing agent
- What do current leases actually rent for vs. the listed asking? Can we see a recent rent roll and the last 12 months of T-12 income?
- What does the HOA fee cover, when was the last increase, and are there any pending special assessments or reserve-fund shortfalls?
- Any open or pending special assessments — roof, HVAC, plumbing, elevator, façade? What's the per-unit balance and payoff schedule, and is the seller paying it off at close or rolling it to the buyer?
- Is there a deadline driving the sale (1031 exchange, divorce, estate, relocation)? That informs how much negotiation room exists.
- Schools are B-rated — typically a magnet for longer-tenancy family renters. What's the average tenant stay here, and is there a school-zone premium baked into asking?
- The area grade is low — what's the realistic commute time and amenity access for the typical tenant pool here? Any planned neighborhood developments (good or bad) we should know about?
- What's the average days-on-market for RENTAL listings here right now (not sales)? A rising rental-DOM trend means longer vacancies and softer asking-rent achievability than the comps imply.
- What's the recent tenant-quality profile in this submarket — average credit score on applications, eviction rate, late-payment / NSF rate, and stable-employment percentage? A property-management company in the area should have these aggregated.
- How much new apartment / multifamily construction is in the pipeline within 1–3 miles? Heavy new supply (>2% of stock underway) typically softens rents 12–24 months out; light construction supports rent growth.
Investment metrics
- 1% rule
- 1.00% ✓
- Cap rate
- 5.53%
- Cash-on-cash
- -2.71%
- DSCR
- 0.88
- GRM
- 8.3
CMA / ARV
- ARV (median comp)
- $215,982
- List price
- $220,000
- Delta
- 11.07%
- Verdict
- OVERPRICED
- Comps
- 20 within 1.0 mi
Projected returns pro-forma
-3.0% appreciation · 8.0% rent growth · sell at horizon
- IRR
- -14.0%
- Equity multiple
- 0.47×
- Total profit
- $-32,620
- Equity at exit
- $32,803
- IRR
- 2.5%
- Equity multiple
- 1.23×
- Total profit
- $14,181
- Equity at exit
- $19,022
Cash invested: $61,600 (down + closing). Projections, not guarantees.
Landlord ↔ Tenant lean methodology
- Overall (STATE)
- 62 Landlord-Friendly
- State Michigan
- 62 Landlord-Friendly · EVEN
- County
- — inherits STATE
- City
- — inherits STATE
ZIP-level market 48331
- Rents YoY
- 9.7%
- Active inventory
- 87
- Price-to-rent
- 8.3×
Monthly cashflow live
- Estimated rent
- $2,202 high interval (Pro) →
- Mortgage (P&I)
- −$1,154
- Tax from tax record
- −$233 /mo · $2,801/yr
- Insurance
- −$92
- HOA
- −$400
- Vacancy / Maint / Mgmt
- −$462
- Net cashflow
- $-139
Break-even live
UW: 25.0% down · 7.5% · 30yr · 1.5% tax · 5.0% vac · 8.0% maint · 8.0% mgmt
Financing live
Cash to close
- Down payment
- $55,000
- Closing costs
- $6,600
- Reserves months
- —
- Total cash needed
- —
Loan-product check · same deal, 3 products live
Conventional
25% down · 7.5% · 30yr
- Down + closing
- —
- Monthly P&I
- —
- Monthly cashflow
- —
- DSCR
- —
- Eligible?
- —
Personal DTI + credit; lowest rate.
DSCR
20% down · 8.5% · 30yr
- Down + closing
- —
- Monthly P&I
- —
- Monthly cashflow
- —
- DSCR
- —
- Eligible?
- —
No personal income docs; deal must DSCR.
Hard money
10% down · 12.0% · 12mo
- Down + closing
- —
- Monthly P&I
- —
- Monthly cashflow
- —
- DSCR
- —
- Eligible?
- —
Short-term bridge; refi at stabilization.
Rent comps 7 comps
| Address | Beds | Baths | Sqft | Rent | $/sqft | DOM | Units | Dist |
|---|---|---|---|---|---|---|---|---|
| 7416 Azalea Ct West Bloomfield, MI | 3.0 | 2.5 | 2469 | $2,600 | $1.05 | 43d | 1 | 0.48mi |
| 29540 Citation Cir Farmington Hills, MI | 1.0–3.0 | 1.0–2.0 | 1075 | $1,940 | $1.80 | 1d | 53 | 0.55mi |
| 7950 Brandywine Blvd West Bloomfield, MI | 2.0–3.0 | 2.0–2.5 | 1982 | $2,474 | $1.25 | 1d | 4 | 0.88mi |
| 30850 Collingdale Dr Novi, MI | 3.0 | 1.5 | 1260 | $2,175 | $1.73 | 24d | 1 | 1.30mi |
| 6603 Berry Creek Ln West Bloomfield, MI | 3.0 | 2.5 | 2445 | $3,400 | $1.39 | 24d | 1 | 1.36mi |
| 6423 Silverbrook W West Bloomfield, MI | 2.0–3.0 | 2.0–2.5 | 1586 | $1,653 | $1.04 | 2d | 33 | 1.37mi |
| 39500 Champion Cir Novi, MI | 1.0–3.0 | 1.0–3.5 | 1337 | $2,578 | $1.93 | 1d | 13 | 1.44mi |
HOA detail condo
- Monthly dues
- $400 · $4,800/yr
- Likely covers
- landscapingpool
- Assessments
- None detected in remarks — confirm with the listing agent.
Listing history 27 events
-
2026-06-18days on market $220,000 Active 8 DOM
-
2026-06-17days on market $220,000 Active 7 DOM
-
2026-06-16days on market $220,000 Active 6 DOM
-
2026-06-15days on market $220,000 Active 5 DOM
-
2026-06-13days on market $220,000 Active 3 DOM
-
2026-06-13pricedays on market $220,000 Active 2 DOM
-
2026-06-09days on market $239,900 Active 89 DOM
-
2026-06-08days on market $239,900 Active 88 DOM
-
2026-06-07days on market $239,900 Active 87 DOM
-
2026-06-04days on market $239,900 Active 84 DOM
-
2026-06-03days on market $239,900 Active 83 DOM
-
2026-06-02days on market $239,900 Active 82 DOM
-
2026-06-01days on market $239,900 Active 81 DOM
-
2026-05-31days on market $239,900 Active 80 DOM
-
2026-03-12$239,900 Active 1051-char remark
Show marketing remark (1055 chars)
Rare Opportunity! Beautiful GROUND LEVEL END-UNIT RANCH CONDO with a finished basement, private patio, and attached garage, located in the highly desirable Crosswinds of Farmington Hills community. Residents enjoy fantastic amenities including a sparkling pool, tennis courts, and beautifully landscaped grounds. Step into a welcoming foyer with ceramic flooring that opens to a spacious great room featuring a vaulted ceiling, a cozy fireplace, and a doorwall leading to a private deck—perfect for relaxing or entertaining. The dining area also showcases a vaulted ceiling and flows seamlessly into the bright kitchen, complete with a skylight and included appliances. The generous primary suite offers a vaulted ceiling and a private bath designed for comfort and convenience. The finished basement provides additional living space with a large family/recreation room, along with a laundry and utility area, offering excellent storage. Enjoy the ease of maintenance-free living in a prime location close to shopping, dining, and major expressways.
-
2026-03-12$239,900 Active 1055-char remark
Show marketing remark (1055 chars)
Rare Opportunity! Beautiful GROUND LEVEL END-UNIT RANCH CONDO with a finished basement, private patio, and attached garage, located in the highly desirable Crosswinds of Farmington Hills community. Residents enjoy fantastic amenities including a sparkling pool, tennis courts, and beautifully landscaped grounds. Step into a welcoming foyer with ceramic flooring that opens to a spacious great room featuring a vaulted ceiling, a cozy fireplace, and a doorwall leading to a private deck—perfect for relaxing or entertaining. The dining area also showcases a vaulted ceiling and flows seamlessly into the bright kitchen, complete with a skylight and included appliances. The generous primary suite offers a vaulted ceiling and a private bath designed for comfort and convenience. The finished basement provides additional living space with a large family/recreation room, along with a laundry and utility area, offering excellent storage. Enjoy the ease of maintenance-free living in a prime location close to shopping, dining, and major expressways.
-
2026-01-14historical
-
2025-10-07$259,900 Active
-
2025-10-07$259,900 Active
-
2014-12-10soldstatus $115,000
-
2014-10-29soldstatus $115,000
-
2014-10-29soldstatus $115,000
-
2014-09-20historical
-
2014-08-07$124,900
-
2014-08-07$124,900
-
1996-09-18soldstatus $125,000
-
1989-10-25soldstatus $99,500
ⓘ Source: listings_history table (triggers on properties + properties_extension) + one-shot
backfill from property_details.listing_events for pre-trigger history.
Tax reassessment forecast MI · Partial reset (capped growth)
- Current annual tax
- $2,801 · $233/mo
- Projected year-2 tax
- $3,095 · $258/mo
- Expected delta
- +$293/yr (+$24/mo · 10.5%)
ⓘ Screening estimate from a state-policy table — verify with the county assessor before closing.
Climate risk First Street
- Flood 1/10 Low FEMA zone X (unshaded) · 0% chance over 30 yrs
- Wildfire 1/10 Low
- Heat 2/10 Low 7 d/yr ≥96°F today · 15 d/yr by 30 yrs out
- Wind 2/10 Low
- Air quality 3/10 Moderate 2 unhealthy d/yr today · 4 by 30 yrs out
Nearby sold comps map
Loading sold comps map…
Walkable amenities ~0.75 mi
Loading nearby amenities…
Taxation est. · year 1
- Rental income
- $26,425
- − Mortgage interest
- −$12,323
- − Property taxes
- −$2,801
- − Insurance
- −$1,100
- − Repairs & maintenance
- −$2,114
- − Management
- −$2,114
- − HOA
- −$4,800
- − Depreciation
- −$6,400
- Taxable loss
- −$5,227
- Est. tax savings @ 24.0%
- +$1,255
- After-tax cash flow
- $-415/yr
For passive investors: Depreciation is non-cash, so a rental often shows a tax loss while cash-flowing — sheltering income. Rental losses are passive: they offset passive income freely, and up to $25,000/yr can offset ordinary (W-2) income if you actively participate and your MAGI is under $100k (phasing out to $0 by $150k); unused losses carry forward. On sale, claimed depreciation is recaptured at up to 25%, and gains may owe capital-gains tax (a 1031 exchange can defer both). Figures are a year-1 estimate at your 24.0% rate — not tax advice; consult a CPA.
Schools (NCES district)
- District
- Walled Lake Consolidated Schools
- NCES district ID
- 2635160
- Math proficiency
- 52% ▼ -4.00%
- Reading proficiency
- 60% ▼ -1.00%
- Median HH income
- $69,184
- Composite
- 49.57/100
- National rank
- #1987
- State rank
- #58 of 540 in MI
Livability — Farmington Hills
- Score
- 81/100
- State rank
- #64
- US rank
- #1364
Category grades
Schools grade is shown separately in the Schools card above.
Census & demographics
- Census place
- Farmington Hills, MI
- County
- Oakland County · 1,009,092 people
- City population
- 67,612
- Metro
- Detroit-Warren-Dearborn, MI
- Population (ZIP)
- 21,562
- Household income
- $127,633
- Rent vs Own
- Severe rent burden
- 589.0
Population outlook (Oakland County) Hauer SSP2
- Today (2025)
- 1,335,747 people
- By 2030
- 1,375,100 · +2.9%
- By 2040
- 1,435,385 · +7.5%
- By 2050
- 1,469,250 · +10.0%
- By 2075
- 1,531,946 · +14.7%
- By 2100
- 1,450,485 · +8.6%
Race, ethnicity, and origin ACS 2023
- Neighborhood character
- Majority White (65%)
- Race & ethnicity
- White 65% Black 16% Asian 12% Two or more races 4% Hispanic / Latino 2%
- Common ancestry
- Romanian 7% Arab 3% Scotch-Irish 2%
- Foreign-born
- 23% · Canada, China, South Korea
- Languages at home
- 74% English-only · Arabic 7% Other Indo-European 6% Other Asian/Pacific 3%
Political lean MEDSL · Oakland
- 2024 margin
- D (+10.6) · D 54.4% · R 43.8% · Other 1.9%
- 2008→2024 swing
- -3.9pp toward R · 2008: 14.5pp · 2024: 10.6pp
- All cycles
- 2024: D+10.6 2020: D+14.1 2016: D+8.1 2012: D+8.1 2008: D+14.5
Not yet ingested
- Civics
- —
Market trends
- HPI YoY
- ▼ -174.00%
- Current HPI
- 158.1222
- Rent YoY
- ▲ 9.66%
- Metro
- Detroit-Warren-Dearborn, MI
- State GDP YoY
- ▲ 1.37%
- F500 in state
- 28
Industry mix (Fortune 500 HQ in MI)
| Industry | F500 HQs | Revenue |
|---|---|---|
| Automotive Parts | 3 | $48B |
|
||
| Automotive | 2 | $372B |
|
||
| Chemicals | 1 | $45B |
|
||
| Automotive Retail | 1 | $29B |
|
||
| Healthcare / Medical Devices | 1 | $23B |
|
||
| Automotive Technology | 1 | $20B |
|
||
Price history
+141.1% since first listed13 events — show timeline
- 2026-03-12 Listed $239,900 REALCOMP
- 2026-03-12 Listed $239,900 MiRealSource-MiMLS
- 2026-01-14 Listing Removed — MiRealSource-MiMLS
- 2025-10-07 Listed $259,900 REALCOMP
- 2025-10-07 Listed $259,900 MiRealSource-MiMLS
- 2014-12-10 Sold (Public Records) $115,000 Public Records
- 2014-10-29 Sold (MLS) $115,000 MiRealSource-MiMLS
- 2014-10-29 Sold (MLS) $115,000 REALCOMP
- 2014-09-20 Listing Removed — MiRealSource-MiMLS
- 2014-08-07 Listed $124,900 MiRealSource-MiMLS
- 2014-08-07 Listed $124,900 REALCOMP
- 1996-09-18 Sold (Public Records) $125,000 Public Records
- 1989-10-25 Sold (Public Records) $99,500 Public Records
Property tax history
+6.4%/yrLatest (2025): $2,801 · -5.3% YoY. Source: county tax records.
Cash-flow waterfall
monthlySold comps — $/sqft
last 12 mo · ≤1 miLoading sold comps…