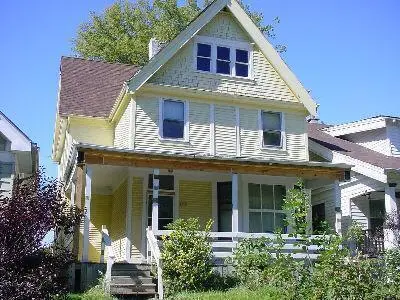
3215 N 20th St
Milwaukee, WI 53206
$1,000C-
3 bd · 1.0 ba ·
1,838 sqft ·
Built 1906
· SingleFamily
· Active
· 21 DOM
Cashflow @ list (25.0% down · 7.5%)
Estimated rent
$1,304/mo
Mortgage (P&I)
−$5
Tax + insurance
−$2
HOA
−$0
Vac / Maint / Mgmt
−$274
Net cashflow
$1,023/mo
Annual
$12,277/yr
Cap rate
1233.95%
Cash-on-cash
4384.51%
DSCR
196.09
1% rule
130.38%
Cash to close
$280
Investor read
- This is a 3-bed/1.0-bath single-family listed at $1k.
- At list price, monthly cash flow is $1k ($12k/yr) — positive.
- The deal already cash-flows at list — no discount required.
- Meets the 1% rule at list price ($1k rent vs $1k).
- It's been on market 21 days — a 2% lower offer ($985) is reasonable based on typical stale-listing flexibility.
- Recommended offer: $985 (1.5% below list) — sets the bar for market timing.
- In year one you build about $107 of equity ($7 loan paydown + $100 appreciation (10.0% local appreciation)).
- Location reads 81/100 on livability (#55 in WI, #1,534 nationally) — a professional / high-income tenant draw. Strengths: amenities A+, commute A+, cost of living A+; Watch: employment D+, schools F, crime F.
- Milwaukee School District (urban): math 10% / reading 18% proficiency, ranked #337 of 342 in WI (top 98%) — low school quality limits family demand, transient renter base, plan for 1-2y turnover; 77% free/reduced lunch — lower-income household profile, screen leases tightly.
- Watch-outs: built in 1906 — expect roof / HVAC / electrical / plumbing capex.
- Market conditions: Rents rising fast (+8.3%/yr); 150 active listings in the ZIP; 12 comparable units currently listed for rent nearby; rentals at typical pace (median 17d on market — plan ~3-4 weeks tenant-placement turnaround); lower-income renter base — watch delinquency; 1,017 units permitted in Milwaukee County in 2024 (803 in 5+ unit buildings).
- Milwaukee County population projected at +4% by 2050 — modest demand growth; plan on rents tracking national, not racing it.
- 6 sale attempts since 13y ago; this cycle's ask has dropped $36k (97%) from the opening price — seller is motivated, your offer sets the floor, not the list.
- At projected returns (10.0% appreciation + 8.0% rent growth), your $280 cash investment doubles in ~1 year — after that, you're playing with house money.
- Cap rate 1234.0% vs local median 5.1% in Milwaukee — top-decile yield for the area; either an underpriced asset or a hidden risk that comps aren't pricing in. Stress-test before assuming the spread holds.
- At $1,304/mo this rent would consume 53% of the median local household income ($29k/yr) (locally 2061% of renters already pay >50% of income on rent) — very limited rent-growth headroom before tenants either downsize or default.
Questions for listing agent
- Built in 1906 — when were the roof, HVAC, electrical panel, plumbing, and water heater last replaced?
- Is there a deadline driving the sale (1031 exchange, divorce, estate, relocation)? That informs how much negotiation room exists.
- Schools are F-rated, which usually means shorter tenancies and higher turnover. Who's the typical renter profile here, and what's been the actual vacancy rate?
- Crime grade is F in this area — have there been break-ins, vandalism, or insurance claims at this property in the last 3 years? What carrier currently insures it and at what premium?
- What's the average days-on-market for RENTAL listings here right now (not sales)? A rising rental-DOM trend means longer vacancies and softer asking-rent achievability than the comps imply.
- What's the recent tenant-quality profile in this submarket — average credit score on applications, eviction rate, late-payment / NSF rate, and stable-employment percentage? A property-management company in the area should have these aggregated.
- How much new for-sale + rental construction is in the pipeline within 1–3 miles? Heavy new supply typically softens prices + rents 12–24 months out; constrained supply supports both.
CashFlowRE · CFR-AHCTT34TYA6QJ8
· Data 2 days ago
cashflowre.app · 2026-05-29