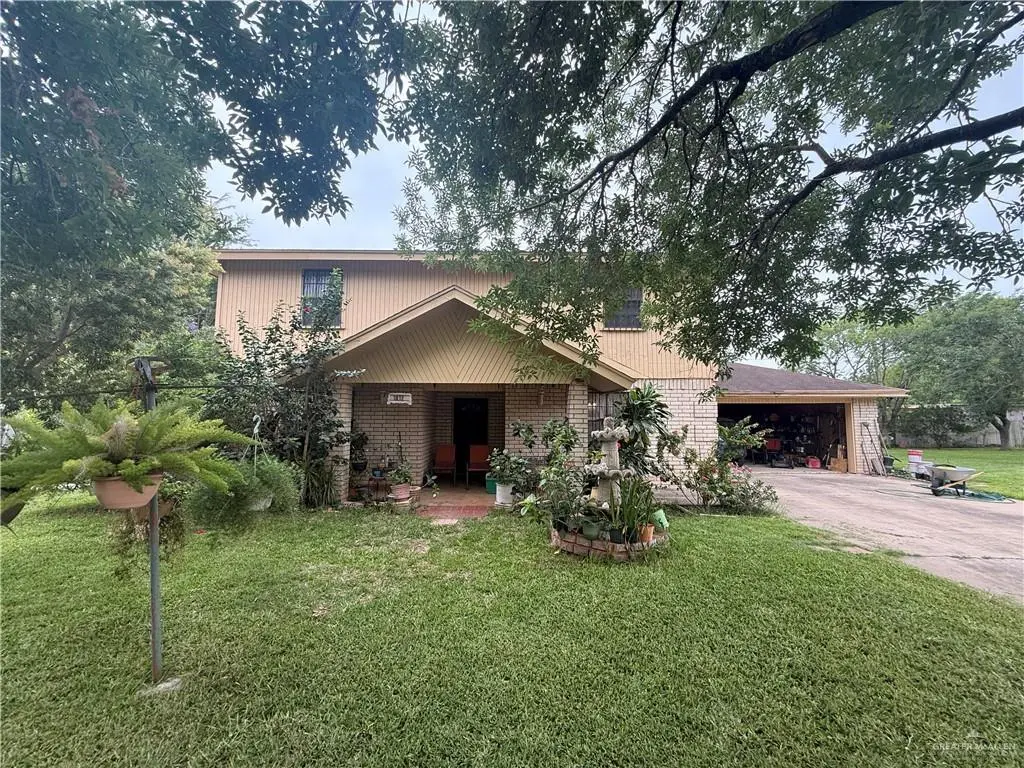
1812 Rosalinda St
Mission, TX 78572
$155,000B
4 bd · 3.0 ba ·
1,980 sqft ·
Built 1987
· SingleFamily
· Pending
· 38 DOM
Cashflow @ list (25.0% down · 7.5%)
Estimated rent
$2,067/mo
Mortgage (P&I)
−$813
Tax + insurance
−$409
HOA
−$0
Vac / Maint / Mgmt
−$434
Net cashflow
$411/mo
Annual
$4,931/yr
Cap rate
9.47%
Cash-on-cash
11.36%
DSCR
1.51
1% rule
1.33%
Cash to close
$43,400
Investor read
- This is a 4-bed/3.0-bath single-family listed at $155k.
- At list price, monthly cash flow is $411 ($5k/yr) — positive.
- The deal already cash-flows at list — no discount required.
- Meets the 1% rule at list price ($2k rent vs $155k).
- It's been on market 38 days — a 3% lower offer ($150k) is reasonable based on typical stale-listing flexibility.
- Recommended offer: $150k (3.0% below list) — sets the bar for market timing.
- Local home prices are declining (-3.0%/yr); year-one equity from $1k of loan paydown is wiped out by about $5k of value loss. Plan a longer hold.
- Location reads 75/100 on livability (#148 in TX, #4,155 nationally) — a middle-class / working-renter tenant base. Strengths: cost of living A+, housing A+, health & safety A+; Watch: amenities F, commute F, employment D-.
- Sharyland ISD (urban): math 34% / reading 44% proficiency, ranked #406 of 826 in TX (top 49%) — families likely to look elsewhere, expect single-tenant / working-renter base with shorter leases.
- Zoned schools: Lloyd & Dolly Bentsen El (math 25% / reading 33%, grade F, #2,668 of 4,322 statewide, top 63%, 559 students, 83% FRL); B L Gray J H (math 50% / reading 55%, grade C+, #293 of 1,662 statewide, top 18%, 730 students, 67% FRL); Sharyland H S (math 36% / reading 58%, grade D-, #591 of 1,632 statewide, top 38%, 1,546 students, 57% FRL).
- Watch-outs: property tax is 2.7% of price.
- Market conditions: Rents flat; 852 active listings in the ZIP; 25 comparable units currently listed for rent nearby; rentals at typical pace (median 24d on market — plan ~3-4 weeks tenant-placement turnaround); 7,378 units permitted in Hidalgo County in 2024 (641 in 5+ unit buildings).
- Hidalgo County population projected at +28% by 2050 — long-run rental-demand tailwind backs the buy-and-hold thesis.
- Climate carrying-cost: severe wind risk, 96% chance of damaging wind over 30y; moderate wildfire risk; extreme-heat days projected 7→22/yr by 2055 (HVAC capex compounding) — expect insurance premiums to compound above CPI over the hold.
- Cap rate 9.5% vs local median 3.5% in Mission — top-decile yield for the area; either an underpriced asset or a hidden risk that comps aren't pricing in. Stress-test before assuming the spread holds.
- At $2,067/mo this rent would consume 46% of the median local household income ($54k/yr) (locally 1714% of renters already pay >50% of income on rent) — very limited rent-growth headroom before tenants either downsize or default.
Questions for listing agent
- It's been on market 38 days. Have you received any prior offers? Is the seller open to a 3% concession, seller financing, or rate buy-down credit?
- Property tax is high relative to price — has the assessment been appealed recently, and will the sale trigger a re-assessment?
- Is there a deadline driving the sale (1031 exchange, divorce, estate, relocation)? That informs how much negotiation room exists.
- What's the average days-on-market for RENTAL listings here right now (not sales)? A rising rental-DOM trend means longer vacancies and softer asking-rent achievability than the comps imply.
- What's the recent tenant-quality profile in this submarket — average credit score on applications, eviction rate, late-payment / NSF rate, and stable-employment percentage? A property-management company in the area should have these aggregated.
- How much new for-sale + rental construction is in the pipeline within 1–3 miles? Heavy new supply typically softens prices + rents 12–24 months out; constrained supply supports both.
CashFlowRE · CFR-AJ3C79EPZP28M0
· Data 6 days ago
cashflowre.app · 2026-05-29