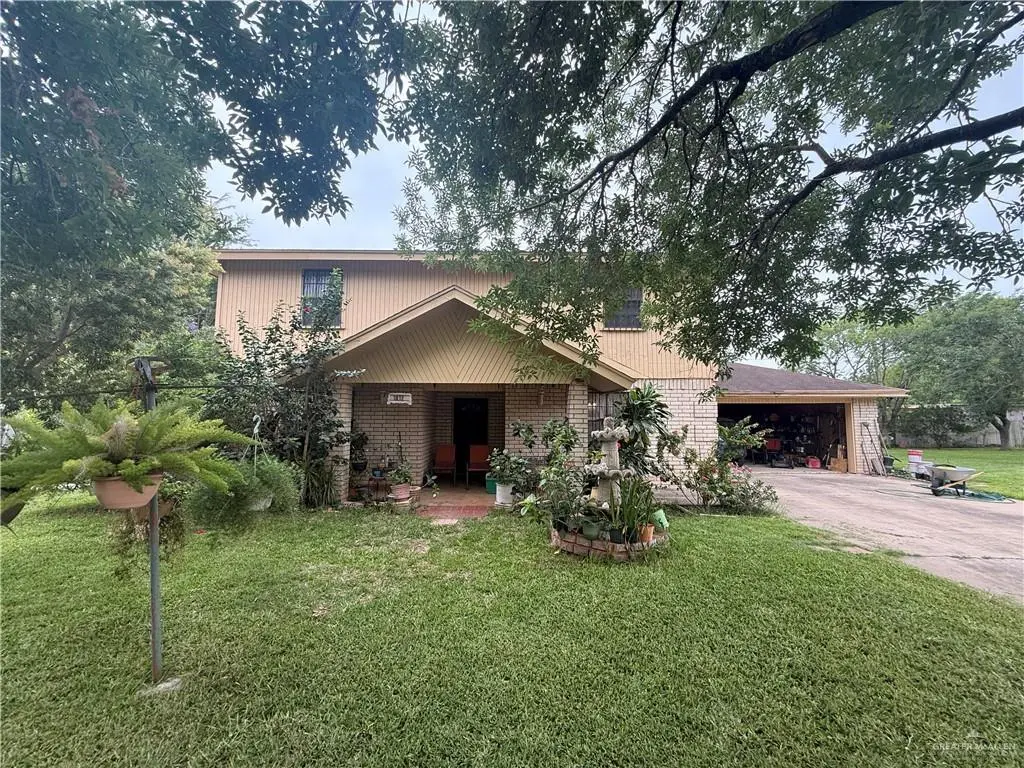
1812 Rosalinda St · Mission, TX
Flood risk 1/10 · Minimal
- FEMA flood zone
- X (shaded)
- Chance of flooding over 30 yrs
- 0.0%
- Est. flood insurance / yr
- $507 – $1,088
Fire risk 5/10 · Moderate
- Est. fire insurance / yr
- $1,222 – $2,270
Heat risk 9/10 · Severe
- Hot days now (above 111°F)
- 7 days/yr
- Hot days in 30 yrs
- 22 days/yr
Wind risk 8/10 · Major
- Chance of severe wind over 30 yrs
- 96.0%
Air-quality risk 2/10 · Minimal
- Unhealthy air days now
- 1 days/yr
- Unhealthy air days in 30 yrs
- 2 days/yr
Risk factors via First Street. Map © Google.
Why this score? — see what drove the B grade
The composite is a weighted blend of 9 inputs, each scored 0–100. Each bar is that input's sub-score; the figure is the points it added to the 100-point composite (weight × sub-score).
- Cash flow +26.5/30.0
- ARV discount +15.0/15.0
- DSCR +9.1/10.0
- 1% rule +8.3/10.0
- Livability +3.8/5.0
- Schools +3.4/10.0
- Rent growth +2.7/5.0
- Condition / age +2.5/5.0
- Appreciation +0.0/10.0
$155,000
🖨 Deal sheet 📄 Offer letter ✓ Due diligence
Listing remarks
This 3 bedroom 2 bath two story home located in Mission TX within Sharyland ISD offers 1,980 sqft of living space on a 7,370 sqft lot. Built on a slab foundation, it features a spacious layout and a great outdoor area perfect for relaxing or entertaining. The home is conveniently located near plenty of shopping and dining options, making it a great combination of space and location.
Key facts
- Two story home
- Great outdoor area
- Spacious layout
Tags
Property features AI
Finance
- HOA & community: No association
Exterior
- Parking: Attached garage (1 car); 1 covered parking space; Total of 1 parking space
- Utilities: City sewer
- Home design: Property with attached garage; Facing direction not specified
- Construction: Brick and wood siding construction; Shingle roof; Slab foundation; Building area approximately 1,980 square feet
- Exterior features: Balcony; Mature trees; Storage structure on property; Paved road access
Interior
- Kitchen: No conveying appliances; Water heater located in garage
- Flooring: Carpet; Tile
- Bathrooms: 2 full bathrooms
- Heating & cooling: Central heating; Central air conditioning
- Interior features: Laminate countertops; Ceiling fan(s); Window coverings
- Laundry & utility: Laundry area
Neighborhood map
What this means for you Summary
Snapshot
- This is a 4-bed/3.0-bath single-family listed at $155k.
Deal economics
- At list price, monthly cash flow is $411 ($5k/yr) — positive.
- The deal already cash-flows at list — no discount required.
- Meets the 1% rule at list price ($2k rent vs $155k).
- Recommended offer: $150k (3.0% below list) — sets the bar for market timing.
- Cap rate 9.5% vs local median 3.5% in Mission — top-decile yield for the area; either an underpriced asset or a hidden risk that comps aren't pricing in. Stress-test before assuming the spread holds.
Location & tenants
- Location reads 75/100 on livability (#148 in TX, #4,155 nationally) — a middle-class / working-renter tenant base. Strengths: cost of living A+, housing A+, health & safety A+; Watch: amenities F, commute F, employment D-.
- Sharyland ISD (urban): math 34% / reading 44% proficiency, ranked #406 of 826 in TX (top 49%) — families likely to look elsewhere, expect single-tenant / working-renter base with shorter leases.
- Zoned schools: Lloyd & Dolly Bentsen El (math 25% / reading 33%, grade F, #2,668 of 4,322 statewide, top 63%, 559 students, 83% FRL); B L Gray J H (math 50% / reading 55%, grade C+, #293 of 1,662 statewide, top 18%, 730 students, 67% FRL); Sharyland H S (math 36% / reading 58%, grade D-, #591 of 1,632 statewide, top 38%, 1,546 students, 57% FRL).
- Market conditions: Rents flat; 852 active listings in the ZIP; 25 comparable units currently listed for rent nearby; rentals at typical pace (median 24d on market — plan ~3-4 weeks tenant-placement turnaround); 7,378 units permitted in Hidalgo County in 2024 (641 in 5+ unit buildings).
- At $2,067/mo this rent would consume 46% of the median local household income ($54k/yr) (locally 1714% of renters already pay >50% of income on rent) — very limited rent-growth headroom before tenants either downsize or default.
Forward outlook
- Local home prices are declining (-3.0%/yr); year-one equity from $1k of loan paydown is wiped out by about $5k of value loss. Plan a longer hold.
- Hidalgo County population projected at +28% by 2050 — long-run rental-demand tailwind backs the buy-and-hold thesis.
Negotiation context
- It's been on market 38 days — a 3% lower offer ($150k) is reasonable based on typical stale-listing flexibility.
Risks & watch-outs
- Watch-outs: property tax is 2.7% of price.
- Climate carrying-cost: severe wind risk, 96% chance of damaging wind over 30y; moderate wildfire risk; extreme-heat days projected 7→22/yr by 2055 (HVAC capex compounding) — expect insurance premiums to compound above CPI over the hold.
Questions for the listing agent
- It's been on market 38 days. Have you received any prior offers? Is the seller open to a 3% concession, seller financing, or rate buy-down credit?
- Property tax is high relative to price — has the assessment been appealed recently, and will the sale trigger a re-assessment?
- Is there a deadline driving the sale (1031 exchange, divorce, estate, relocation)? That informs how much negotiation room exists.
- What's the average days-on-market for RENTAL listings here right now (not sales)? A rising rental-DOM trend means longer vacancies and softer asking-rent achievability than the comps imply.
- What's the recent tenant-quality profile in this submarket — average credit score on applications, eviction rate, late-payment / NSF rate, and stable-employment percentage? A property-management company in the area should have these aggregated.
- How much new for-sale + rental construction is in the pipeline within 1–3 miles? Heavy new supply typically softens prices + rents 12–24 months out; constrained supply supports both.
Investment metrics
- 1% rule
- 1.33% ✓
- Cap rate
- 9.47%
- Cash-on-cash
- 11.36%
- DSCR
- 1.51
- GRM
- 6.3
CMA / ARV
- ARV (median comp)
- $199,450
- List price
- $155,000
- Delta
- -22.29%
- Verdict
- UNDERPRICED
- Comps
- 20 within 1.0 mi
Show comp detail 12 sales within ~0.75 mi
| Address | Dist | Beds/Ba | Sqft | Sold | Price | $/sf | Match |
|---|---|---|---|---|---|---|---|
| 1621 Dalobo Blvd | 0.28mi | 4/2.5 | 2,013 (+2%) | 14mo | $209,999 | $104 | 71 |
| 1927 Sunset Dr | 0.17mi | 3/2.5 (-1) | 1,827 (-8%) | 9mo | $268,999 | $147 | 65 |
| 1613 Jonathon Dr | 0.60mi | 4/2.0 | 2,002 (+1%) | 5mo | $266,900 | $133 | 62 |
| 1811 Jonathon Dr | 0.57mi | 3/3.0 (-1) | 1,967 (-1%) | 8mo | $305,000 | $155 | 60 |
| 1707 Sebastian St | 0.47mi | 4/3.0 | 2,077 (+5%) | 13mo | $319,000 | $154 | 59 |
| 501 Capricorn St | 0.32mi | 3/3.0 (-1) | 2,157 (+9%) | 9mo | $214,900 | $100 | 58 |
| 701 Helen St | 0.66mi | 3/3.5 (-1) | 1,922 (-3%) | 3mo | $355,900 | $185 | 54 |
| 2028 Loker St | 0.54mi | 3/2.0 (-1) | 2,038 (+3%) | 9mo | $159,900 | $78 | 53 |
| 1911 Jonathon Dr | 0.58mi | 3/2.5 (-1) | 1,893 (-4%) | 7mo | $285,000 | $151 | 53 |
| 1703 Audrey Dr | 0.53mi | 4/3.5 | 2,157 (+9%) | 6mo | $358,000 | $166 | 53 |
| 2101 Colorado St | 0.66mi | 3/2.0 (-1) | 1,875 (-5%) | 5mo | $310,000 | $165 | 47 |
| 1515 Duke St | 0.73mi | 4/3.5 | 2,209 (+12%) | 1mo | $415,000 | $188 | 44 |
Match score weights: distance 35% · size 25% · config 20% · recency 20%. Top-matched comps best support the ARV.
Projected returns pro-forma
-3.0% appreciation · 0.93% rent growth · sell at horizon
- IRR
- -1.9%
- Equity multiple
- 0.93×
- Total profit
- $-3,040
- Equity at exit
- $23,111
- IRR
- 5.2%
- Equity multiple
- 1.34×
- Total profit
- $14,953
- Equity at exit
- $13,402
Cash invested: $43,400 (down + closing). Projections, not guarantees.
Landlord ↔ Tenant lean methodology
- Overall (STATE)
- 87 Strongly Landlord-Friendly
- State Texas
- 87 Strongly Landlord-Friendly · R+5
- County
- — inherits STATE
- City
- — inherits STATE
ZIP-level market 78572
- Home prices YoY
- -22.9%
- Rents YoY
- 0.9%
- Active inventory
- 852
- Price-to-rent
- 6.3×
Monthly cashflow live
- Estimated rent
- $2,067 high interval (Pro) →
- Mortgage (P&I)
- −$813
- Tax from tax record
- −$344 /mo · $4,131/yr
- Insurance
- −$65
- HOA
- −$0
- Vacancy / Maint / Mgmt
- −$434
- Net cashflow
- $411
Break-even live
UW: 25.0% down · 7.5% · 30yr · 1.5% tax · 5.0% vac · 8.0% maint · 8.0% mgmt
Financing live
Cash to close
- Down payment
- $38,750
- Closing costs
- $4,650
- Reserves months
- —
- Total cash needed
- —
Loan-product check · same deal, 3 products live
Conventional
25% down · 7.5% · 30yr
- Down + closing
- —
- Monthly P&I
- —
- Monthly cashflow
- —
- DSCR
- —
- Eligible?
- —
Personal DTI + credit; lowest rate.
DSCR
20% down · 8.5% · 30yr
- Down + closing
- —
- Monthly P&I
- —
- Monthly cashflow
- —
- DSCR
- —
- Eligible?
- —
No personal income docs; deal must DSCR.
Hard money
10% down · 12.0% · 12mo
- Down + closing
- —
- Monthly P&I
- —
- Monthly cashflow
- —
- DSCR
- —
- Eligible?
- —
Short-term bridge; refi at stabilization.
Rent comps 25 comps
| Address | Beds | Baths | Sqft | Rent | $/sqft | DOM | Units | Dist |
|---|---|---|---|---|---|---|---|---|
| 1822 Sunset Dr Mission, TX | 3.0 | 2.5 | 1631 | $1,850 | $1.13 | 14d | 1 | 0.14mi |
| 1923 Sunset Dr Mission, TX | 3.0 | 2.5 | 1499 | $1,850 | $1.23 | 21d | 1 | 0.15mi |
| 1927 Sunset Dr Mission, TX | 3.0 | 2.0 | 1827 | $1,900 | $1.04 | 44d | 1 | 0.17mi |
| 2007 Cassandra St Mission, TX | 3.0 | 2.5 | 1422 | $2,500 | $1.76 | 14d | 1 | 0.18mi |
| 2210 E 1st St Unit 22 Mission, TX | 3.0 | 3.5 | 1500 | $1,600 | $1.07 | 19d | 1 | 0.50mi |
| 814 Cimarron Dr Mission, TX | 3.0 | 2.5 | 1376 | $1,875 | $1.36 | 14d | 1 | 0.65mi |
| 813 Travis St #207 Mission, TX | 3.0 | 2.0 | 1320 | $1,600 | $1.21 | 23d | 1 | 0.67mi |
| 813 Travis St #408 Mission, TX | 3.0 | 2.0 | 1230 | $1,800 | $1.46 | 23d | 1 | 0.67mi |
| 2202 Colorado St Mission, TX | 4.0 | 3.5 | 2036 | $2,190 | $1.08 | 23d | 1 | 0.72mi |
| 1503 Duke St Mission, TX | 4.0 | 3.5 | 2401 | $4,500 | $1.87 | 43d | 1 | 0.77mi |
| 1511 Evergreen Ave Mission, TX | 3.0 | 2.0 | 1286 | $1,300 | $1.01 | 43d | 1 | 0.80mi |
| 402 Hackberry Ave Mission, TX | 3.0 | 2.5 | 1950 | $2,100 | $1.08 | 23d | 1 | 0.94mi |
| 211 Driftwood Ave Mission, TX | 4.0 | 3.5 | 2614 | $3,100 | $1.19 | 23d | 1 | 0.98mi |
| 2435 E 7th Ave Mission, TX | 3.0 | 3.0 | 2366 | $2,300 | $0.97 | 44d | 1 | 1.01mi |
| 2436 E 8th Ave Mission, TX | 3.0 | 3.0 | 1987 | $2,700 | $1.36 | 44d | 1 | 1.03mi |
| 919 Lucia Dr Mission, TX | 3.0 | 2.5 | 2060 | $2,700 | $1.31 | 23d | 1 | 1.16mi |
| 1801 Crown Pointe Blvd Mission, TX | 3.0 | 2.0 | 1609 | $1,650 | $1.03 | 14d | 1 | 1.19mi |
| 204 San Saba St Mission, TX | 3.0 | 3.0 | 2115 | $1,950 | $0.92 | 43d | 1 | 1.24mi |
| 203 San Saba St Mission, TX | 3.0 | 2.5 | 1737 | $2,250 | $1.30 | 23d | 1 | 1.26mi |
| 2200 E 19th St Mission, TX | 3.0 | 2.0 | 1829 | $1,950 | $1.07 | 43d | 1 | 1.30mi |
| 1606 Terrace Dr Mission, TX | 4.0 | 3.0 | 2127 | $2,600 | $1.22 | 14d | 1 | 1.31mi |
| 2203 E 19th St Mission, TX | 3.0 | 2.0 | 1856 | $2,300 | $1.24 | 23d | 1 | 1.32mi |
| 2201 E 21st St Mission, TX | 4.0 | 2.0 | 1529 | $1,850 | $1.21 | 14d | 1 | 1.44mi |
| 4900 Tyler Ave McAllen, TX | 2.0–3.0 | 2.5 | 1244 | $1,745 | $1.40 | 14d | 1 | 1.46mi |
| 4900 Toronto Ave McAllen, TX | 3.0 | 2.5 | 1333 | $1,545 | $1.16 | 23d | 1 | 1.47mi |
Listing history 12 events
-
2026-06-14statusdays on market $155,000 Pending 38 DOM
-
2026-06-10days on market $155,000 Option 36 DOM
-
2026-06-09days on market $155,000 Option 35 DOM
-
2026-06-08days on market $155,000 Option 34 DOM
-
2026-06-07statusdays on market $155,000 Option 33 DOM
-
2026-06-03days on market $155,000 Active 29 DOM
-
2026-06-02days on market $155,000 Active 28 DOM
-
2026-06-01days on market $155,000 Active 27 DOM
-
2026-05-31days on market $155,000 Active 26 DOM
-
2026-05-31days on market $155,000 Active 25 DOM
-
2026-05-05$165,000 Active 385-char remark
-
1988-05-03soldstatus
ⓘ Source: listings_history table (triggers on properties + properties_extension) + one-shot
backfill from property_details.listing_events for pre-trigger history.
Tax reassessment forecast TX · Resets to sale price
- Current annual tax
- $4,131 · $344/mo
- Projected year-2 tax
- $4,131 · $344/mo
- Expected delta
- $0/yr ($0/mo · 0.0%)
ⓘ Screening estimate from a state-policy table — verify with the county assessor before closing.
Climate risk First Street
- Flood 1/10 Low FEMA zone X (shaded) · 0% chance over 30 yrs
- Wildfire 5/10 Major
- Heat 9/10 Extreme 7 d/yr ≥111°F today · 22 d/yr by 30 yrs out
- Wind 8/10 Severe 96% chance of damaging wind over 30 yrs
- Air quality 2/10 Low 1 unhealthy d/yr today · 2 by 30 yrs out
Nearby sold comps map
Loading sold comps map…
Walkable amenities ~0.75 mi
Loading nearby amenities…
Taxation est. · year 1
- Rental income
- $24,798
- − Mortgage interest
- −$8,682
- − Property taxes
- −$4,131
- − Insurance
- −$775
- − Repairs & maintenance
- −$1,984
- − Management
- −$1,984
- − Depreciation
- −$4,509
- Taxable income
- $2,733
- Est. tax owed @ 24.0%
- −$656
- After-tax cash flow
- $4,275/yr
For passive investors: Depreciation is non-cash, so a rental often shows a tax loss while cash-flowing — sheltering income. Rental losses are passive: they offset passive income freely, and up to $25,000/yr can offset ordinary (W-2) income if you actively participate and your MAGI is under $100k (phasing out to $0 by $150k); unused losses carry forward. On sale, claimed depreciation is recaptured at up to 25%, and gains may owe capital-gains tax (a 1031 exchange can defer both). Figures are a year-1 estimate at your 24.0% rate — not tax advice; consult a CPA.
Schools (NCES district)
- District
- Sharyland ISD
- NCES district ID
- 4839930
- Math proficiency
- 34% ▼ -35.00%
- Reading proficiency
- 44% ▼ -15.00%
- Median HH income
- $57,792
- Composite
- 34.38/100
- National rank
- #5214
- State rank
- #406 of 826 in TX
Livability — Mission
- Score
- 75/100
- State rank
- #148
- US rank
- #4155
Category grades
Schools grade is shown separately in the Schools card above.
Census & demographics
- Census place
- Mission, TX
- County
- Hidalgo County · 623,128 people
- City population
- 78,024
- Metro
- McAllen-Edinburg-Mission, TX
- Population (ZIP)
- 78,024
- Household income
- $54,298
- Rent vs Own
- Severe rent burden
- 1714.0
Population outlook (Hidalgo County) Hauer SSP2
- Today (2025)
- 955,232 people
- By 2030
- 1,009,774 · +5.7%
- By 2040
- 1,120,332 · +17.3%
- By 2050
- 1,225,036 · +28.2%
- By 2075
- 1,439,189 · +50.7%
- By 2100
- 1,533,429 · +60.5%
Race, ethnicity, and origin ACS 2023
- Neighborhood character
- Predominantly Hispanic (85%)
- Race & ethnicity
- Hispanic / Latino 85% Two or more races 47% White 12% Asian 2%
- Hispanic origin (detail)
- Mexican 80%
- Common ancestry
- Slovak 1% Portuguese 0%
- Foreign-born
- 28% · Canada, South Korea
- Languages at home
- 22% English-only · Spanish 76%
Political lean MEDSL · Hidalgo
- 2024 margin
- Toss-up / Even · D 48.1% · R 51.0%
- 2008→2024 swing
- -41.6pp toward R · 2008: 38.7pp · 2024: -2.9pp
- All cycles
- 2024: R+2.9 2020: D+17.1 2016: D+40.5 2012: D+41.8 2008: D+38.7
Not yet ingested
- Civics
- —
Market trends
- HPI YoY
- ▼ -62.35%
- Current HPI
- 209.3573
- Rent YoY
- ▲ 0.93%
- Metro
- McAllen-Edinburg-Mission, TX
- State GDP YoY
- ▲ 3.95%
- F500 in state
- 110
Industry mix (Fortune 500 HQ in TX)
| Industry | F500 HQs | Revenue |
|---|---|---|
| Energy | 16 | $1,198B |
|
||
| Technology | 5 | $198B |
|
||
| Engineering / Construction | 4 | $72B |
|
||
| Energy Services | 3 | $60B |
|
||
| Utilities | 3 | $41B |
|
||
| Healthcare | 2 | $330B |
|
||
Price history
-6.1% since first listed5 events — show timeline
- 2026-06-13 Pending — MCALLENMLS
- 2026-06-04 Contingent — MCALLENMLS
- 2026-05-28 Price Changed $155,000 MCALLENMLS
- 2026-05-05 Listed $165,000 MCALLENMLS
- 1988-05-03 Sold (Public Records) — Public Records
Property tax history
+4.6%/yrLatest (2025): $4,131 · +10.0% YoY. Source: county tax records.
Cash-flow waterfall
monthlySold comps — $/sqft
last 12 mo · ≤1 miLoading sold comps…