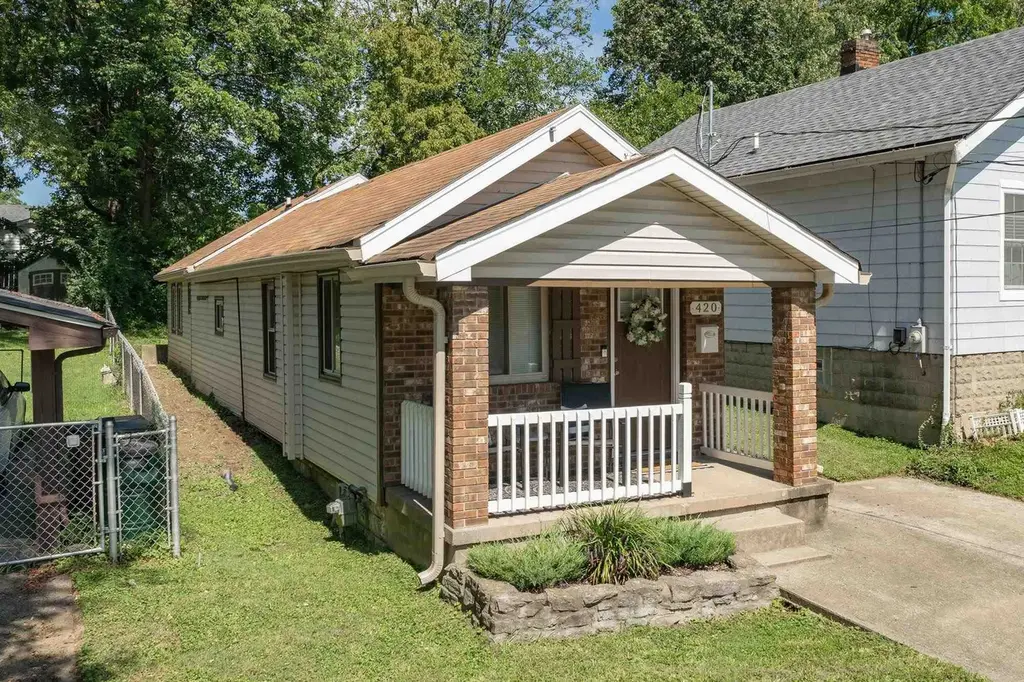
420 Buckner St
Elsmere, KY 41018
$150,000D
1 bd · 1.0 ba ·
1,020 sqft ·
Built —
· SingleFamily
· Active
· 10 DOM
Cashflow @ list (25.0% down · 7.5%)
Estimated rent
$1,156/mo
Mortgage (P&I)
−$787
Tax + insurance
−$236
HOA
−$0
Vac / Maint / Mgmt
−$243
Net cashflow
$-109/mo
Annual
$-1,308/yr
Cap rate
5.42%
Cash-on-cash
-3.11%
DSCR
0.86
1% rule
0.77%
Cash to close
$42,000
Investor read
- This is a 1-bed/1.0-bath single-family listed at $150k.
- At list price, monthly cash flow is $-109 ($-1k/yr) — negative.
- To cash-flow at today's rent, offer at most $131k (12.8% below list).
- To meet the 1% rule (rent ≥ 1% of price), the offer needs to be $116k (22.9% below list).
- Only 10 days on market — expect competitive offers; lowballing is unlikely to land.
- Recommended offer: $116k (22.9% below list) — sets the bar for 1% rule.
- Local home prices are declining (-3.0%/yr); year-one equity from $1k of loan paydown is wiped out by about $4k of value loss. Plan a longer hold.
- Location reads 72/100 on livability (#121 in KY) — a middle-class / working-renter tenant base. Strengths: crime A+, cost of living A+, housing A+; Watch: commute C-, amenities F, health & safety F.
- Erlanger-Elsmere Independent (suburban): math 21% / reading 32% proficiency, ranked #128 of 165 in KY (top 78%) — low school quality limits family demand, transient renter base, plan for 1-2y turnover.
- Zoned schools: Howell Elementary School (math 22% / reading 27%, grade F, #489 of 676 statewide, top 76%, 291 students, 50% FRL); Tichenor Middle School (math 19% / reading 38%, grade F, #161 of 217 statewide, top 75%, 539 students, 54% FRL); Lloyd High School (math 22% / reading 32%, grade F, #158 of 254 statewide, top 68%, 697 students, 57% FRL) — zoned schools at 53% FRL track the district average.
- Market conditions: Rents rising fast (+4.2%/yr); 125 active listings in the ZIP; 6 comparable units currently listed for rent nearby; rentals leasing fast (median 4d on market — plan ~1-2 weeks tenant-placement turnaround); 699 units permitted in Kenton County in 2024 (287 in 5+ unit buildings).
- Kenton County population projected at +5% by 2050 — modest demand growth; plan on rents tracking national, not racing it.
- 9 sale attempts since 22y ago with the ask held roughly flat each time — persistent listings suggest the price (not the market) is what's stuck; bring a comps-based counter.
Questions for listing agent
- What do current leases actually rent for vs. the listed asking? Can we see a recent rent roll and the last 12 months of T-12 income?
- Is there a deadline driving the sale (1031 exchange, divorce, estate, relocation)? That informs how much negotiation room exists.
- Schools are F-rated, which usually means shorter tenancies and higher turnover. Who's the typical renter profile here, and what's been the actual vacancy rate?
- The area grade is low — what's the realistic commute time and amenity access for the typical tenant pool here? Any planned neighborhood developments (good or bad) we should know about?
- What's the average days-on-market for RENTAL listings here right now (not sales)? A rising rental-DOM trend means longer vacancies and softer asking-rent achievability than the comps imply.
- What's the recent tenant-quality profile in this submarket — average credit score on applications, eviction rate, late-payment / NSF rate, and stable-employment percentage? A property-management company in the area should have these aggregated.
- How much new for-sale + rental construction is in the pipeline within 1–3 miles? Heavy new supply typically softens prices + rents 12–24 months out; constrained supply supports both.
CashFlowRE · CFR-AJ4GBP0Z7TQY6Q
· Data 1 h ago
cashflowre.app · 2026-05-29