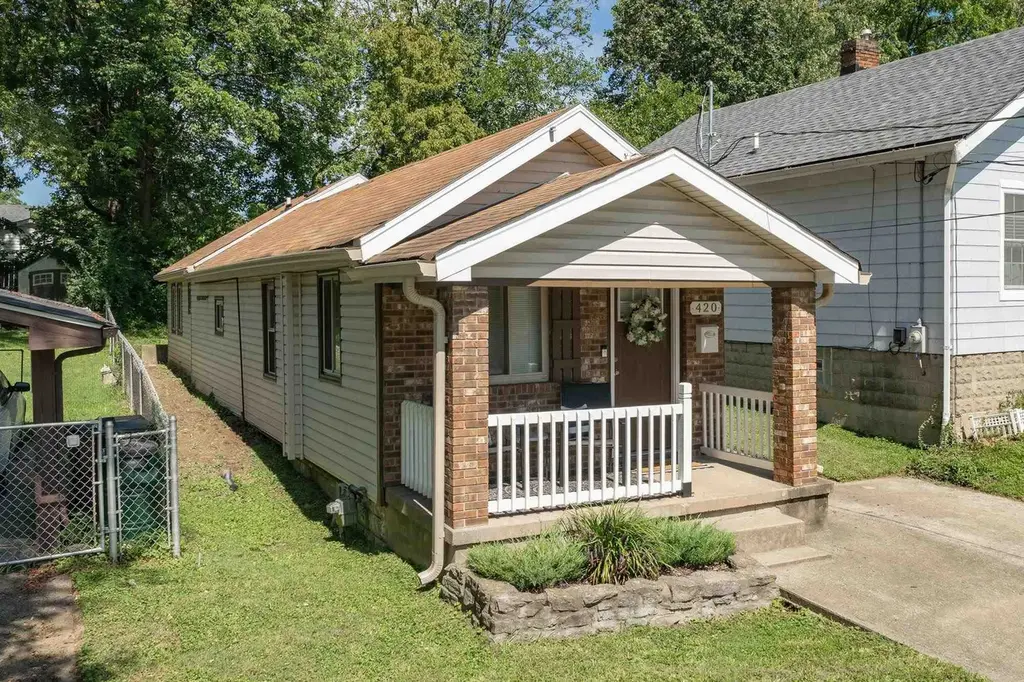
420 Buckner St · Elsmere, KY
Flood risk 1/10 · Minimal
- FEMA flood zone
- X (unshaded)
- Chance of flooding over 30 yrs
- 0.0%
- Est. flood insurance / yr
- $507 – $1,088
Fire risk 1/10 · Minimal
- Est. fire insurance / yr
- $839 – $1,559
Heat risk 4/10 · Minor
- Hot days now (above 103°F)
- 7 days/yr
- Hot days in 30 yrs
- 19 days/yr
Wind risk 2/10 · Minimal
- Chance of severe wind over 30 yrs
- 1.0%
Air-quality risk 2/10 · Minimal
- Unhealthy air days now
- 1 days/yr
- Unhealthy air days in 30 yrs
- 3 days/yr
Risk factors via First Street. Map © Google.
Why this score? — see what drove the D grade
The composite is a weighted blend of 9 inputs, each scored 0–100. Each bar is that input's sub-score; the figure is the points it added to the 100-point composite (weight × sub-score).
- ARV discount +14.3/15.0
- Cash flow +9.3/30.0
- Rent growth +3.6/5.0
- Livability +3.6/5.0
- 1% rule +2.7/10.0
- DSCR +2.6/10.0
- Condition / age +2.5/5.0
- Schools +2.3/10.0
- Appreciation +0.0/10.0
$150,000
🖨 Deal sheet (PDF) 📄 Offer letter ✓ Due diligence
Listing remarks MLS
Recently Remodel Home in the heart of Elsmere/Erlanger on a great street that is convenient to all! Open concept Living into a great kitchen with stainless steel appliances, new cabinets, and a large island with a butcher block counter. Large master with a huge walk in closet just for you! Why pay rent when you can have a home that is all your own!
Key facts
- Heart of elsmere
- Close to restaurants
- Close to schools
Tags
Property features AI
Finance
- Other: Has a view
- Financial info: Home warranty included
Exterior
- Parking: Driveway (no garage)
- Utilities: Public water; Public sewer; Cable available
- Home design: Single family residence; One level; House
- Construction: Aluminum siding; Block foundation; Shingle roof; Existing structure
- Exterior features: Porch; Aluminum clad windows; Aluminum and wood fencing; Shed(s) / storage; Level lot; City street frontage; Paved road
Interior
- Kitchen: Stainless steel appliances; Electric range; Dishwasher; Disposal; Microwave; Refrigerator; Kitchen island
- Bedrooms: Primary bedroom on main level (17 x 12)
- Bathrooms: 1 full bathroom
- Heating & cooling: Central air conditioning; Forced air heating
- Interior features: Kitchen island; Open floor plan; Ceiling fan(s); Recessed lighting; Living room (14 x 13); Dining room (9 x 13); Kitchen (15 x 13); Primary bedroom (17 x 12); Primary bath (10 x 7); Additional room (14 x 7)
- Laundry & utility: Washer and dryer included; Laundry on main level
Neighborhood map
What this means for you Summary
Snapshot
- This is a 1-bed/1.0-bath single-family listed at $150k.
Deal economics
- At list price, monthly cash flow is $-109 ($-1k/yr) — negative.
- To cash-flow at today's rent, offer at most $131k (12.8% below list).
- To meet the 1% rule (rent ≥ 1% of price), the offer needs to be $116k (22.9% below list).
- Recommended offer: $116k (22.9% below list) — sets the bar for 1% rule.
Location & tenants
- Location reads 72/100 on livability (#121 in KY) — a middle-class / working-renter tenant base. Strengths: crime A+, cost of living A+, housing A+; Watch: commute C-, amenities F, health & safety F.
- Erlanger-Elsmere Independent (suburban): math 21% / reading 32% proficiency, ranked #128 of 165 in KY (top 78%) — low school quality limits family demand, transient renter base, plan for 1-2y turnover.
- Zoned schools: Howell Elementary School (math 22% / reading 27%, grade F, #489 of 676 statewide, top 76%, 291 students, 50% FRL); Tichenor Middle School (math 19% / reading 38%, grade F, #161 of 217 statewide, top 75%, 539 students, 54% FRL); Lloyd High School (math 22% / reading 32%, grade F, #158 of 254 statewide, top 68%, 697 students, 57% FRL) — zoned schools at 53% FRL track the district average.
- Market conditions: Rents rising fast (+4.2%/yr); 124 active listings in the ZIP; 6 comparable units currently listed for rent nearby; rentals leasing fast (median 4d on market — plan ~1-2 weeks tenant-placement turnaround); 699 units permitted in Kenton County in 2024 (287 in 5+ unit buildings).
Forward outlook
- Local home prices are declining (-3.0%/yr); year-one equity from $1k of loan paydown is wiped out by about $4k of value loss. Plan a longer hold.
- Kenton County population projected at +5% by 2050 — modest demand growth; plan on rents tracking national, not racing it.
Negotiation context
- Only 9 days on market — expect competitive offers; lowballing is unlikely to land.
- 9 sale attempts since 22y ago with the ask held roughly flat each time — persistent listings suggest the price (not the market) is what's stuck; bring a comps-based counter.
Questions for the listing agent
- What do current leases actually rent for vs. the listed asking? Can we see a recent rent roll and the last 12 months of T-12 income?
- Is there a deadline driving the sale (1031 exchange, divorce, estate, relocation)? That informs how much negotiation room exists.
- Schools are F-rated, which usually means shorter tenancies and higher turnover. Who's the typical renter profile here, and what's been the actual vacancy rate?
- The area grade is low — what's the realistic commute time and amenity access for the typical tenant pool here? Any planned neighborhood developments (good or bad) we should know about?
- What's the average days-on-market for RENTAL listings here right now (not sales)? A rising rental-DOM trend means longer vacancies and softer asking-rent achievability than the comps imply.
- What's the recent tenant-quality profile in this submarket — average credit score on applications, eviction rate, late-payment / NSF rate, and stable-employment percentage? A property-management company in the area should have these aggregated.
- How much new for-sale + rental construction is in the pipeline within 1–3 miles? Heavy new supply typically softens prices + rents 12–24 months out; constrained supply supports both.
Investment metrics
- 1% rule
- 0.77% ✗
- Cap rate
- 5.42%
- Cash-on-cash
- -3.11%
- DSCR
- 0.86
- GRM
- 10.8
CMA / ARV
- ARV (median comp)
- $176,847
- List price
- $150,000
- Delta
- -12.35%
- Verdict
- UNDERPRICED
- Comps
- 20 within 1.0 mi
Show comp detail 12 sales within ~0.75 mi
| Address | Dist | Beds/Ba | Sqft | Sold | Price | $/sf | Match |
|---|---|---|---|---|---|---|---|
| 214 Lytle Ave | 0.49mi | 2/1.0 (+1) | 1,048 (+3%) | 0mo | $205,000 | $196 | 67 |
| 412 Garvey Ave | 0.19mi | 2/1.0 (+1) | 896 (-12%) | 5mo | $160,000 | $179 | 62 |
| 1446 Garvey Ave | 0.49mi | 2/1.0 (+1) | 912 (-11%) | 1mo | $200,000 | $219 | 54 |
| 443 Bedinger St | 0.33mi | 2/2.0 (+1) | 928 (-9%) | 9mo | $202,500 | $218 | 53 |
| 9 Rosebud Ave | 0.60mi | 2/2.0 (+1) | 1,088 (+7%) | 1mo | $140,000 | $129 | 51 |
| 14 Linwood Ave | 0.58mi | 2/1.0 (+1) | 1,056 (+4%) | 14mo | $144,000 | $136 | 51 |
| 3304 Elizabeth St | 0.73mi | 2/1.0 (+1) | 1,068 (+5%) | 8mo | $172,000 | $161 | 46 |
| 635 Willow St | 0.42mi | 2/1.5 (+1) | 1,136 (+11%) | 10mo | $175,000 | $154 | 46 |
| 107 Mcalpin Ave | 0.70mi | 2/1.0 (+1) | 1,121 (+10%) | 3mo | $228,000 | $203 | 43 |
| 40 Eastern Ave | 0.72mi | 2/1.0 (+1) | 986 (-3%) | 16mo | $127,500 | $129 | 42 |
| 426 Timberlake Ave | 0.50mi | 2/2.0 (+1) | 1,168 (+14%) | 4mo | $230,000 | $197 | 40 |
| 17 Lytle Ave | 0.53mi | 2/1.5 (+1) | 877 (-14%) | 8mo | $152,500 | $174 | 38 |
Match score weights: distance 35% · size 25% · config 20% · recency 20%. Top-matched comps best support the ARV.
Projected returns pro-forma
-3.0% appreciation · 4.22% rent growth · sell at horizon
- IRR
- -20.2%
- Equity multiple
- 0.29×
- Total profit
- $-29,802
- Equity at exit
- $22,365
- IRR
- -10.8%
- Equity multiple
- 0.31×
- Total profit
- $-28,811
- Equity at exit
- $12,969
Cash invested: $42,000 (down + closing). Projections, not guarantees.
Landlord ↔ Tenant lean methodology
- Overall (STATE)
- 83 Strongly Landlord-Friendly
- State Kentucky
- 83 Strongly Landlord-Friendly · R+16
- County
- — inherits STATE
- City
- — inherits STATE
ZIP-level market 41018
- Rents YoY
- 4.2%
- Active inventory
- 124
- Price-to-rent
- 10.8×
Monthly cashflow live
- Estimated rent
- $1,156 high interval (Pro) →
- Mortgage (P&I)
- −$787
- Tax from tax record
- −$173 /mo · $2,078/yr
- Insurance
- −$62
- HOA
- −$0
- Vacancy / Maint / Mgmt
- −$243
- Net cashflow
- $-109
Break-even live
Sensitivity live
| Price | -10% $-24 | -5% $-67 | +0% $-109 | +5% $-151 | +10% $-194 |
|---|---|---|---|---|---|
| Rent | -10% $-200 | -5% $-155 | +0% $-109 | +5% $-63 | +10% $-18 |
| Rate | -1.0pp $-33 | -0.5pp $-71 | base $-109 | +0.5pp $-148 | +1.0pp $-187 |
UW: 25.0% down · 7.5% · 30yr · 1.5% tax · 5.0% vac · 8.0% maint · 8.0% mgmt
Financing live
Cash to close
- Down payment
- $37,500
- Closing costs
- $4,500
- Reserves months
- —
- Total cash needed
- —
Loan-product check · same deal, 3 products live
Conventional
25% down · 7.5% · 30yr
- Down + closing
- —
- Monthly P&I
- —
- Monthly cashflow
- —
- DSCR
- —
- Eligible?
- —
Personal DTI + credit; lowest rate.
DSCR
20% down · 8.5% · 30yr
- Down + closing
- —
- Monthly P&I
- —
- Monthly cashflow
- —
- DSCR
- —
- Eligible?
- —
No personal income docs; deal must DSCR.
Hard money
10% down · 12.0% · 12mo
- Down + closing
- —
- Monthly P&I
- —
- Monthly cashflow
- —
- DSCR
- —
- Eligible?
- —
Short-term bridge; refi at stabilization.
Rent comps 6 comps
| Address | Beds | Baths | Sqft | Rent | $/sqft | DOM | Units | Dist |
|---|---|---|---|---|---|---|---|---|
| 129 Dove Dr Elsmere, KY | 2.0 | 1.0 | 784 | $1,070 | $1.36 | 21d | 1 | 0.63mi |
| 159 Green River Dr Erlanger, KY | 2.0 | 2.0 | 1278 | $1,595 | $1.25 | 0d | 1 | 0.84mi |
| 43 Banklick St Florence, KY | 2.0 | 2.0 | 1265 | $1,355 | $1.07 | 5d | 3 | 1.27mi |
| 6827 Shenandoah Dr Florence, KY | 1.0 | 1.0 | 750 | $988 | $1.32 | 4d | 5 | 1.28mi |
| 6805 Sebree Dr Florence, KY | 1.0–3.0 | 1.0–1.5 | 901 | $1,067 | $1.18 | 0d | 14 | 1.33mi |
| 3422 Cintonya Dr Erlanger, KY | 1.0–2.0 | 1.0 | 625 | $1,030 | $1.65 | 0d | 8 | 1.38mi |
Listing history 33 events
-
2026-06-21days on market $150,000 Active 9 DOM
-
2026-06-18days on market $150,000 Active 6 DOM
-
2026-06-17days on market $150,000 Active 5 DOM
-
2026-06-16days on market $150,000 Active 4 DOM
-
2026-06-15days on market $150,000 Active 3 DOM
-
2026-06-13pricestatusdays on market $150,000 Active 1 DOM
-
2026-05-09historical
-
2026-03-25price $155,000
-
2026-03-07price $165,000
-
2026-02-14$175,000 Active
-
2022-02-01soldstatus $134,900
-
2022-01-28soldstatus $134,900 Sold 353-char remark
Show marketing remark (353 chars)
Recently Remodel Home in the heart of Elsmere/Erlanger on a great street that is convenient to all! Open concept Living into a great kitchen with stainless steel appliances, new cabinets, and a large island with a butcher block counter. Large master with a huge walk in closet just for you! Why pay rent when you can have a home that is all your own!
-
2021-10-22status Pending 353-char remark
Show marketing remark (353 chars)
Recently Remodel Home in the heart of Elsmere/Erlanger on a great street that is convenient to all! Open concept Living into a great kitchen with stainless steel appliances, new cabinets, and a large island with a butcher block counter. Large master with a huge walk in closet just for you! Why pay rent when you can have a home that is all your own!
-
2021-10-14price $134,900 353-char remark
Show marketing remark (353 chars)
Recently Remodel Home in the heart of Elsmere/Erlanger on a great street that is convenient to all! Open concept Living into a great kitchen with stainless steel appliances, new cabinets, and a large island with a butcher block counter. Large master with a huge walk in closet just for you! Why pay rent when you can have a home that is all your own!
-
2021-09-30$139,900 Active 353-char remark
Show marketing remark (353 chars)
Recently Remodel Home in the heart of Elsmere/Erlanger on a great street that is convenient to all! Open concept Living into a great kitchen with stainless steel appliances, new cabinets, and a large island with a butcher block counter. Large master with a huge walk in closet just for you! Why pay rent when you can have a home that is all your own!
-
2021-09-30historical
Show marketing remark (353 chars)
Recently Remodel Home in the heart of Elsmere/Erlanger on a great street that is convenient to all! Open concept Living into a great kitchen with stainless steel appliances, new cabinets, and a large island with a butcher block counter. Large master with a huge walk in closet just for you! Why pay rent when you can have a home that is all your own!
-
2021-09-23price $152,500
-
2021-09-11$155,000 Active
-
2020-01-29soldstatus $104,000
-
2020-01-22soldstatus $104,000 Closed
-
2019-10-25status Pending
-
2019-10-21price $104,900
-
2019-10-05$109,900 Active
-
2014-08-04soldstatus $18,000
-
2014-08-01soldstatus $18,000
-
2014-06-23$19,900
-
2014-04-22historical
-
2013-11-09$25,900
-
2012-08-09soldstatus $10,000
-
2012-08-07$10,000
-
2004-12-19historical
-
2004-06-19$83,900
-
1989-12-20soldstatus $29,900
ⓘ Source: listings_history table (triggers on properties + properties_extension) + one-shot
backfill from property_details.listing_events for pre-trigger history.
Tax reassessment forecast KY · Resets to sale price
- Current annual tax
- $2,078 · $173/mo
- Projected year-2 tax
- $2,078 · $173/mo
- Expected delta
- $0/yr ($0/mo · 0.0%)
ⓘ Screening estimate from a state-policy table — verify with the county assessor before closing.
Climate risk First Street
- Flood 1/10 Low FEMA zone X (unshaded) · 0% chance over 30 yrs
- Wildfire 1/10 Low
- Heat 4/10 Moderate 7 d/yr ≥103°F today · 19 d/yr by 30 yrs out
- Wind 2/10 Low 100% chance of damaging wind over 30 yrs
- Air quality 2/10 Low 1 unhealthy d/yr today · 3 by 30 yrs out
Nearby sold comps map
Loading sold comps map…
Walkable amenities ~0.75 mi
Loading nearby amenities…
Taxation est. · year 1
- Rental income
- $13,873
- − Mortgage interest
- −$8,402
- − Property taxes
- −$2,078
- − Insurance
- −$750
- − Repairs & maintenance
- −$1,110
- − Management
- −$1,110
- − Depreciation
- −$4,364
- Taxable loss
- −$3,941
- Est. tax savings @ 24.0%
- +$946
- After-tax cash flow
- $-362/yr
For passive investors: Depreciation is non-cash, so a rental often shows a tax loss while cash-flowing — sheltering income. Rental losses are passive: they offset passive income freely, and up to $25,000/yr can offset ordinary (W-2) income if you actively participate and your MAGI is under $100k (phasing out to $0 by $150k); unused losses carry forward. On sale, claimed depreciation is recaptured at up to 25%, and gains may owe capital-gains tax (a 1031 exchange can defer both). Figures are a year-1 estimate at your 24.0% rate — not tax advice; consult a CPA.
Schools (NCES district)
- District
- Erlanger-Elsmere Independent
- NCES district ID
- 2101740
- Math proficiency
- 21% ▼ -10.00%
- Reading proficiency
- 32% ▼ -11.00%
- Median HH income
- $47,377
- Composite
- 23.01/100
- National rank
- #7975
- State rank
- #128 of 165 in KY
Livability — Elsmere
- Score
- 72/100
- State rank
- #121
- US rank
- #5733
Category grades
Schools grade is shown separately in the Schools card above.
Census & demographics
- Census place
- Elsmere, KY
- County
- Kenton County · 142,881 people
- City population
- 28,707
- Metro
- Cincinnati, OH-KY-IN
- Population (ZIP)
- 28,940
- Household income
- $68,605
- Rent vs Own
- Severe rent burden
- 678.0
Population outlook (Kenton County) Hauer SSP2
- Today (2025)
- 174,205 people
- By 2030
- 177,897 · +2.1%
- By 2040
- 182,671 · +4.9%
- By 2050
- 183,543 · +5.4%
- By 2075
- 178,977 · +2.7%
- By 2100
- 159,920 · -8.2%
Race, ethnicity, and origin ACS 2023
- Neighborhood character
- Predominantly White (83%)
- Race & ethnicity
- White 83% Two or more races 7% Hispanic / Latino 5% Black 5% Asian 1%
- Hispanic origin (detail)
- Mexican 3%
- Common ancestry
- Slovak 3% Italian 2% Lithuanian 1%
- Foreign-born
- 4% · Canada, Vietnam
- Languages at home
- 94% English-only · Spanish 4%
Political lean MEDSL · Kenton
- 2024 margin
- Strong R (+21.7) · D 38.2% · R 59.9% · Other 1.9%
- 2008→2024 swing
- -0.9pp no change · 2008: -20.9pp · 2024: -21.7pp
- All cycles
- 2024: R+21.7 2020: R+19.3 2016: R+26.1 2012: R+24.3 2008: R+20.9
Not yet ingested
- Civics
- —
Market trends
- HPI YoY
- ▼ -211.57%
- Current HPI
- 215.9599
- Rent YoY
- ▲ 4.22%
- Metro
- Cincinnati, OH-KY-IN
- State GDP YoY
- ▲ 1.81%
- F500 in state
- 4
Industry mix (Fortune 500 HQ in KY)
| Industry | F500 HQs | Revenue |
|---|---|---|
| Healthcare | 1 | $118B |
|
||
| Food / Beverage | 1 | $7B |
|
||
Price history
+401.7% since first listed28 events — show timeline
- 2026-06-12 Listed $150,000 NKMLS
- 2026-05-09 Listing Removed — NKMLS
- 2026-03-25 Price Changed $155,000 NKMLS
- 2026-03-07 Price Changed $165,000 NKMLS
- 2026-02-14 Listed $175,000 NKMLS
- 2022-02-01 Sold (Public Records) $134,900 Public Records
- 2022-01-28 Sold (MLS) $134,900 NKMLS
- 2021-10-22 Pending — NKMLS
- 2021-10-14 Price Changed $134,900 NKMLS
- 2021-09-30 Listed $139,900 NKMLS
- 2021-09-30 Listing Removed — NKMLS
- 2021-09-23 Price Changed $152,500 NKMLS
- 2021-09-11 Listed $155,000 NKMLS
- 2020-01-29 Sold (Public Records) $104,000 Public Records
- 2020-01-22 Sold (MLS) $104,000 NKMLS
- 2019-10-25 Pending — NKMLS
- 2019-10-21 Price Changed $104,900 NKMLS
- 2019-10-05 Listed $109,900 NKMLS
- 2014-08-04 Sold (Public Records) $18,000 Public Records
- 2014-08-01 Sold (MLS) $18,000 NKMLS
- 2014-06-23 Listed $19,900 NKMLS
- 2014-04-22 Listing Removed — NKMLS
- 2013-11-09 Listed $25,900 NKMLS
- 2012-08-09 Sold (MLS) $10,000 NKMLS
- 2012-08-07 Listed $10,000 NKMLS
- 2004-12-19 Listing Removed — NKMLS
- 2004-06-19 Listed $83,900 NKMLS
- 1989-12-20 Sold (Public Records) $29,900 Public Records
Property tax history
+27.1%/yrLatest (2025): $2,078 · -1.0% YoY. Source: county tax records.
Cash-flow waterfall
monthlySold comps — $/sqft
last 12 mo · ≤1 miLoading sold comps…