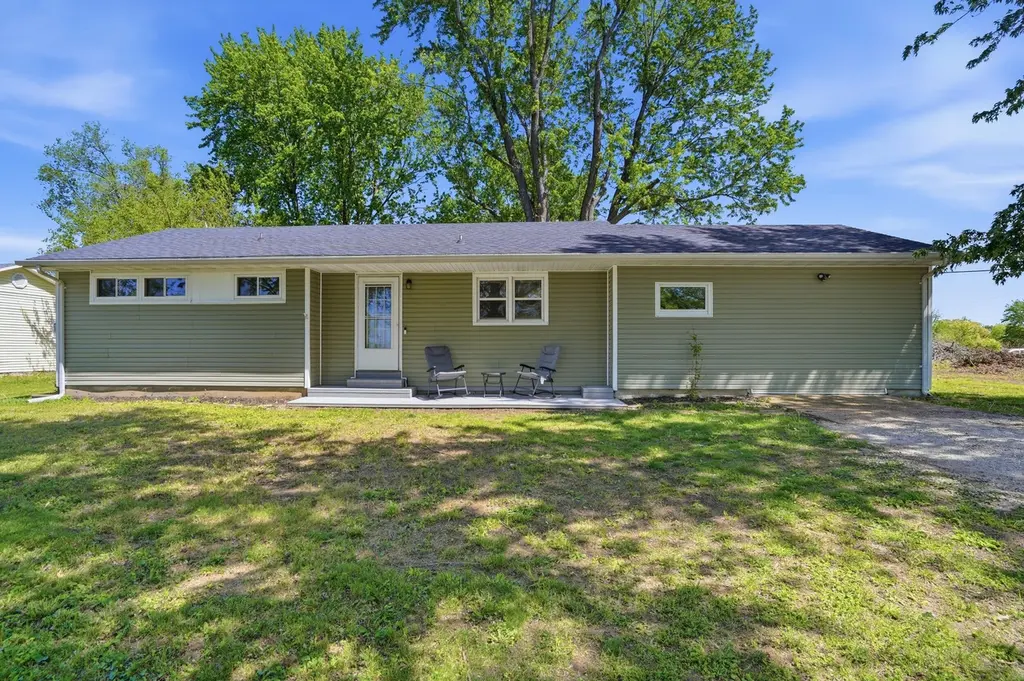
2109 S Country Club Dr
Jefferson City, MO 65109
$189,900D+
3 bd · 1.0 ba ·
1,460 sqft ·
Built 1955
· SingleFamily
· Pending
· 31 DOM
Cashflow @ list (25.0% down · 7.5%)
Estimated rent
$1,415/mo
Mortgage (P&I)
−$996
Tax + insurance
−$150
HOA
−$0
Vac / Maint / Mgmt
−$297
Net cashflow
$-28/mo
Annual
$-330/yr
Cap rate
6.12%
Cash-on-cash
-0.62%
DSCR
0.97
1% rule
0.75%
Cash to close
$53,172
Investor read
- This is a 3-bed/1.0-bath single-family listed at $190k.
- At list price, monthly cash flow is $-28 ($-330/yr) — negative.
- To cash-flow at today's rent, offer at most $185k (2.6% below list).
- To meet the 1% rule (rent ≥ 1% of price), the offer needs to be $142k (25.5% below list).
- It's been on market 31 days — a 3% lower offer ($184k) is reasonable based on typical stale-listing flexibility.
- Recommended offer: $142k (25.5% below list) — sets the bar for 1% rule.
- Local home prices are declining (-3.0%/yr); year-one equity from $1k of loan paydown is wiped out by about $6k of value loss. Plan a longer hold.
- Location reads 83/100 on livability (#7 in MO, #838 nationally) — a professional / high-income tenant draw. Strengths: cost of living A+, housing A+, health & safety A+; Watch: crime C-.
- Jefferson City (urban): math 34% / reading 48% proficiency, ranked #121 of 324 in MO (top 37%) — families likely to look elsewhere, expect single-tenant / working-renter base with shorter leases.
- Zoned schools: Clarence Lawson Elem. (math 43% / reading 52%, grade D, #342 of 1,115 statewide, top 31%, 419 students, 53% FRL); Thomas Jefferson Middle (math 33% / reading 44%, grade F, #202 of 391 statewide, top 54%, 957 students, 52% FRL); Capital City High School (math 45% / reading 67%, grade C, #59 of 521 statewide, top 11%, 1,404 students, 41% FRL) — zoned schools at 49% FRL track the district average.
- Watch-outs: built in 1955 — expect roof / HVAC / electrical / plumbing capex.
- Market conditions: Rents rising fast (+10.2%/yr); 248 active listings in the ZIP; 2 comparable units currently listed for rent nearby; 173 units permitted in Cole County in 2024 (0 in 5+ unit buildings).
- Cole County population projected to shrink 5% by 2050 — rents likely to lag national; underwrite the cash flow, not the appreciation.
- 7 sale attempts since 7y ago with the ask held roughly flat each time — persistent listings suggest the price (not the market) is what's stuck; bring a comps-based counter.
- Cap rate 6.1% vs local median 3.7% in Jefferson City — top-decile yield for the area; either an underpriced asset or a hidden risk that comps aren't pricing in. Stress-test before assuming the spread holds.
Questions for listing agent
- What do current leases actually rent for vs. the listed asking? Can we see a recent rent roll and the last 12 months of T-12 income?
- It's been on market 31 days. Have you received any prior offers? Is the seller open to a 25% concession, seller financing, or rate buy-down credit?
- Built in 1955 — when were the roof, HVAC, electrical panel, plumbing, and water heater last replaced?
- Is there a deadline driving the sale (1031 exchange, divorce, estate, relocation)? That informs how much negotiation room exists.
- Schools are B-rated — typically a magnet for longer-tenancy family renters. What's the average tenant stay here, and is there a school-zone premium baked into asking?
- The area grade is low — what's the realistic commute time and amenity access for the typical tenant pool here? Any planned neighborhood developments (good or bad) we should know about?
- What's the average days-on-market for RENTAL listings here right now (not sales)? A rising rental-DOM trend means longer vacancies and softer asking-rent achievability than the comps imply.
- What's the recent tenant-quality profile in this submarket — average credit score on applications, eviction rate, late-payment / NSF rate, and stable-employment percentage? A property-management company in the area should have these aggregated.
CashFlowRE · CFR-AMJ20A3G5F4YMM
· Data 3 days ago
cashflowre.app · 2026-05-29