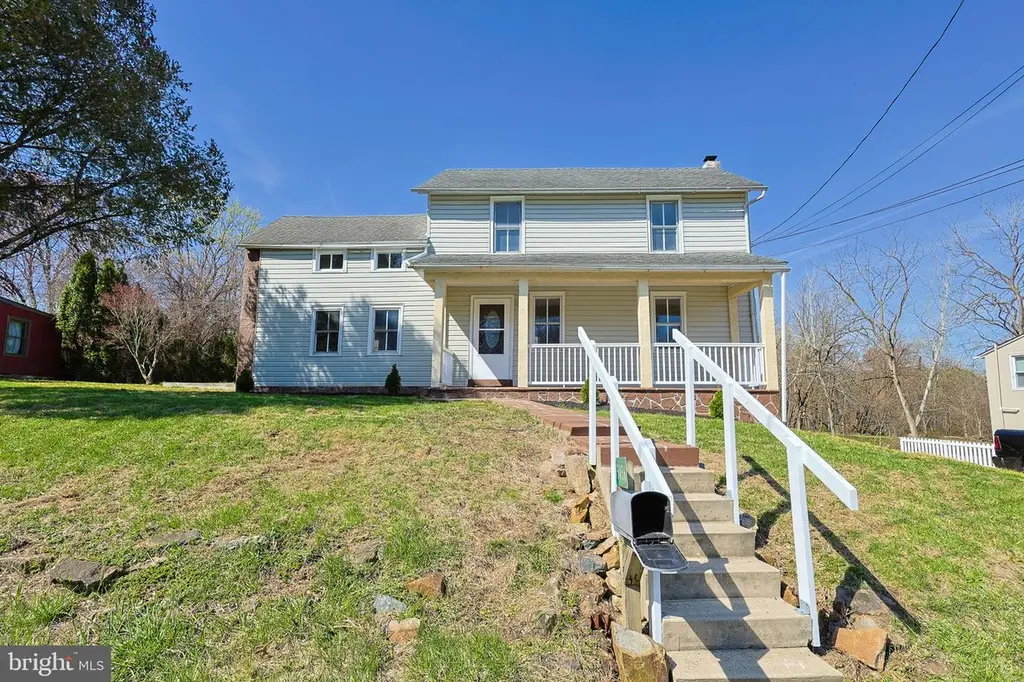
5456 Vera Cruz Rd
Emmaus, PA 18049
$305,000C-
3 bd · 1.0 ba ·
2,048 sqft ·
Built 1850
· SingleFamily
· Pending
· 13 DOM
Cashflow @ list (25.0% down · 7.5%)
Estimated rent
$2,488/mo
Mortgage (P&I)
−$1,599
Tax + insurance
−$407
HOA
−$0
Vac / Maint / Mgmt
−$522
Net cashflow
$-41/mo
Annual
$-489/yr
Cap rate
6.13%
Cash-on-cash
-0.57%
DSCR
0.97
1% rule
0.82%
Cash to close
$85,400
Investor read
- This is a 3-bed/1.0-bath single-family listed at $305k.
- At list price, monthly cash flow is $-41 ($-489/yr) — negative.
- To cash-flow at today's rent, offer at most $298k (2.4% below list).
- To meet the 1% rule (rent ≥ 1% of price), the offer needs to be $249k (18.4% below list).
- Only 13 days on market — expect competitive offers; lowballing is unlikely to land.
- Recommended offer: $249k (18.4% below list) — sets the bar for 1% rule.
- Local home prices are declining (-3.0%/yr); year-one equity from $2k of loan paydown is wiped out by about $9k of value loss. Plan a longer hold.
- Location reads 86/100 on livability (#61 in PA, #424 nationally) — a professional / high-income tenant draw. Strengths: crime A+, amenities A+, cost of living A+; Watch: commute F.
- East Penn SD (suburban): math 43% / reading 65% proficiency, ranked #103 of 539 in PA (top 19%) — acceptable for families but not a draw, mixed tenant base, ~2y average lease; only 17% free/reduced lunch — higher-income household profile.
- Zoned schools: Emmaus Hs (math 65% / reading 24%, grade D-, #195 of 437 statewide, top 44%, 2,846 students, 24% FRL).
- Watch-outs: built in 1850 — expect roof / HVAC / electrical / plumbing capex.
- Market conditions: Rents rising fast (+6.2%/yr); 95 active listings in the ZIP; 1 comparable units currently listed for rent nearby; solid renter incomes; 765 units permitted in Lehigh County in 2024 (286 in 5+ unit buildings).
- Lehigh County population projected at +21% by 2050 — long-run rental-demand tailwind backs the buy-and-hold thesis.
- Current owner paid $175k; list at $305k implies a 74% gain — meaningful room to come down on a strong offer.
- Climate carrying-cost: moderate wildfire risk — expect insurance premiums to compound above CPI over the hold.
- Cap rate 6.1% vs local median 3.4% in Emmaus — top-decile yield for the area; either an underpriced asset or a hidden risk that comps aren't pricing in. Stress-test before assuming the spread holds.
- This rent runs 32% of the median local income ($94k/yr) — at the standard rent-burdened threshold; future hikes will face affordability resistance.
Questions for listing agent
- What do current leases actually rent for vs. the listed asking? Can we see a recent rent roll and the last 12 months of T-12 income?
- Built in 1850 — when were the roof, HVAC, electrical panel, plumbing, and water heater last replaced?
- Is there a deadline driving the sale (1031 exchange, divorce, estate, relocation)? That informs how much negotiation room exists.
- Schools are A-rated — typically a magnet for longer-tenancy family renters. What's the average tenant stay here, and is there a school-zone premium baked into asking?
- What's the average days-on-market for RENTAL listings here right now (not sales)? A rising rental-DOM trend means longer vacancies and softer asking-rent achievability than the comps imply.
- What's the recent tenant-quality profile in this submarket — average credit score on applications, eviction rate, late-payment / NSF rate, and stable-employment percentage? A property-management company in the area should have these aggregated.
- How much new for-sale + rental construction is in the pipeline within 1–3 miles? Heavy new supply typically softens prices + rents 12–24 months out; constrained supply supports both.
CashFlowRE · CFR-AMTX0968253XP8
· Data 1 week ago
cashflowre.app · 2026-05-29