5456 Vera Cruz Rd · Emmaus, PA
Flood risk 1/10 · Minimal
- FEMA flood zone
- X (unshaded)
- Chance of flooding over 30 yrs
- 0.0%
- Est. flood insurance / yr
- $473 – $860
Fire risk 5/10 · Moderate
- Est. fire insurance / yr
- $511 – $949
Heat risk 4/10 · Minor
- Hot days now (above 99°F)
- 7 days/yr
- Hot days in 30 yrs
- 15 days/yr
Wind risk 4/10 · Minor
- Chance of severe wind over 30 yrs
- 17.0%
Air-quality risk 2/10 · Minimal
- Unhealthy air days now
- 1 days/yr
- Unhealthy air days in 30 yrs
- 2 days/yr
Risk factors via First Street. Map © Google.
Why this score? — see what drove the C- grade
The composite is a weighted blend of 9 inputs, each scored 0–100. Each bar is that input's sub-score; the figure is the points it added to the 100-point composite (weight × sub-score).
- ARV discount +15.0/15.0
- Cash flow +12.6/30.0
- Schools +4.8/10.0
- Livability +4.3/5.0
- Rent growth +4.0/5.0
- DSCR +3.7/10.0
- 1% rule +3.2/10.0
- Condition / age +2.5/5.0
- Appreciation +0.0/10.0
$305,000
🖨 Deal sheet 📄 Offer letter ✓ Due diligence
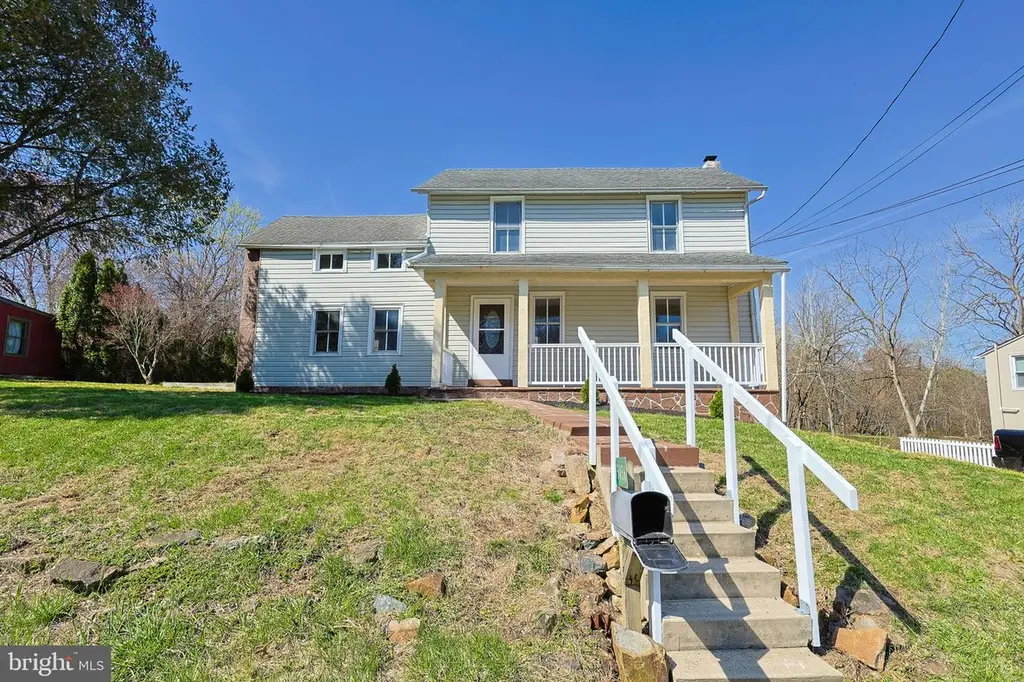
Listing remarks
Located on a quiet street, this updated 1850s farmhouse offers a peaceful setting within the Emmaus Borough and the highly desirable East Penn School District. This home retains its authentic 19th-century footprint and character. Buyers who appreciate historic homes will note the original exposed beams, a traditional root cellar, lower ceilings, and the natural quirks of an 1850 build, including floors and doorframes that are not perfectly square. The home also features the original single-pane windows, and in keeping with the era's architecture, two of the three bedrooms do not have built-in closets. These historic details are paired with comprehensive modern upgrades. The main floor offer
Key facts
- Renovated farmhouse
- Brand new kitchen
- Granite countertops
Tags
Property features AI
Exterior
- Parking: Crushed stone driveway; Driveway parking with three spaces; Three total garage/parking spaces
- Utilities: 100 amp electric service; Public sewer; Well water
- Home design: Detached property; Three levels; Facing direction not specified; Fee simple ownership; Property in very good condition
- Construction: Frame, masonry and vinyl siding construction; Asphalt shingle roof; Stone permanent foundation; Built (year source: assessor)
- Exterior features: Patio(s); Porch(es); Shed; Other exterior features
Interior
- Kitchen: Dishwasher; Refrigerator; Stainless steel appliances; Upgraded countertops
- Bedrooms: Three bedrooms on the upper level
- Flooring: Carpet; Luxury vinyl plank; Luxury vinyl tile
- Bathrooms: One full bathroom (upper level); One half bathroom (main level)
- Heating & cooling: Central heating; 90% efficient forced air; Oil-fired heating; Electric hot water
- Interior features: Attic; Stall shower; Breakfast area; Built-in shelving; Traditional floor plan; Upgraded countertops; Other interior features
- Laundry & utility: Laundry hookups on the main floor
Neighborhood map
What this means for you Summary
Snapshot
- This is a 3-bed/1.0-bath single-family listed at $305k.
Deal economics
- At list price, monthly cash flow is $-41 ($-489/yr) — negative.
- To cash-flow at today's rent, offer at most $298k (2.4% below list).
- To meet the 1% rule (rent ≥ 1% of price), the offer needs to be $249k (18.4% below list).
- Recommended offer: $249k (18.4% below list) — sets the bar for 1% rule.
- Cap rate 6.1% vs local median 3.4% in Emmaus — top-decile yield for the area; either an underpriced asset or a hidden risk that comps aren't pricing in. Stress-test before assuming the spread holds.
Location & tenants
- Location reads 86/100 on livability (#61 in PA, #424 nationally) — a professional / high-income tenant draw. Strengths: crime A+, amenities A+, cost of living A+; Watch: commute F.
- East Penn SD (suburban): math 43% / reading 65% proficiency, ranked #103 of 539 in PA (top 19%) — acceptable for families but not a draw, mixed tenant base, ~2y average lease; only 17% free/reduced lunch — higher-income household profile.
- Zoned schools: Emmaus Hs (math 65% / reading 24%, grade D-, #195 of 437 statewide, top 44%, 2,846 students, 24% FRL).
- Market conditions: Rents rising fast (+6.2%/yr); 95 active listings in the ZIP; 1 comparable units currently listed for rent nearby; solid renter incomes; 765 units permitted in Lehigh County in 2024 (286 in 5+ unit buildings).
- This rent runs 32% of the median local income ($94k/yr) — at the standard rent-burdened threshold; future hikes will face affordability resistance.
Forward outlook
- Local home prices are declining (-3.0%/yr); year-one equity from $2k of loan paydown is wiped out by about $9k of value loss. Plan a longer hold.
- Lehigh County population projected at +21% by 2050 — long-run rental-demand tailwind backs the buy-and-hold thesis.
Negotiation context
- Only 13 days on market — expect competitive offers; lowballing is unlikely to land.
- Current owner paid $175k; list at $305k implies a 74% gain — meaningful room to come down on a strong offer.
Risks & watch-outs
- Watch-outs: built in 1850 — expect roof / HVAC / electrical / plumbing capex.
- Climate carrying-cost: moderate wildfire risk — expect insurance premiums to compound above CPI over the hold.
Questions for the listing agent
- What do current leases actually rent for vs. the listed asking? Can we see a recent rent roll and the last 12 months of T-12 income?
- Built in 1850 — when were the roof, HVAC, electrical panel, plumbing, and water heater last replaced?
- Is there a deadline driving the sale (1031 exchange, divorce, estate, relocation)? That informs how much negotiation room exists.
- Schools are A-rated — typically a magnet for longer-tenancy family renters. What's the average tenant stay here, and is there a school-zone premium baked into asking?
- What's the average days-on-market for RENTAL listings here right now (not sales)? A rising rental-DOM trend means longer vacancies and softer asking-rent achievability than the comps imply.
- What's the recent tenant-quality profile in this submarket — average credit score on applications, eviction rate, late-payment / NSF rate, and stable-employment percentage? A property-management company in the area should have these aggregated.
- How much new for-sale + rental construction is in the pipeline within 1–3 miles? Heavy new supply typically softens prices + rents 12–24 months out; constrained supply supports both.
Investment metrics
- 1% rule
- 0.82% ✗
- Cap rate
- 6.13%
- Cash-on-cash
- -0.57%
- DSCR
- 0.97
- GRM
- 10.2
CMA / ARV
- ARV (on-the-fly)
- $385,024
- Comps found
- 1
Show comp detail 1 sale within ~0.75 mi
| Address | Dist | Beds/Ba | Sqft | Sold | Price | $/sf | Match |
|---|---|---|---|---|---|---|---|
| 5146 Vera Cruz Rd | 0.36mi | 3/2.5 | 1,944 (-5%) | 10mo | $364,900 | $188 | 60 |
Match score weights: distance 35% · size 25% · config 20% · recency 20%. Top-matched comps best support the ARV.
Projected returns pro-forma
-3.0% appreciation · 6.18% rent growth · sell at horizon
- IRR
- -13.9%
- Equity multiple
- 0.49×
- Total profit
- $-43,830
- Equity at exit
- $45,476
- IRR
- -0.8%
- Equity multiple
- 0.93×
- Total profit
- $-5,628
- Equity at exit
- $26,371
Cash invested: $85,400 (down + closing). Projections, not guarantees.
Landlord ↔ Tenant lean methodology
- Overall (STATE)
- 62 Landlord-Friendly
- State Pennsylvania
- 62 Landlord-Friendly · EVEN
- County
- — inherits STATE
- City
- — inherits STATE
ZIP-level market 18049
- Rents YoY
- 6.2%
- Active inventory
- 95
- Price-to-rent
- 10.2×
Monthly cashflow live
- Estimated rent
- $2,488 medium interval (Pro) →
- Mortgage (P&I)
- −$1,599
- Tax from tax record
- −$280 /mo · $3,357/yr
- Insurance
- −$127
- HOA
- −$0
- Vacancy / Maint / Mgmt
- −$522
- Net cashflow
- $-41
Break-even live
UW: 25.0% down · 7.5% · 30yr · 1.5% tax · 5.0% vac · 8.0% maint · 8.0% mgmt
Financing live
Cash to close
- Down payment
- $76,250
- Closing costs
- $9,150
- Reserves months
- —
- Total cash needed
- —
Loan-product check · same deal, 3 products live
Conventional
25% down · 7.5% · 30yr
- Down + closing
- —
- Monthly P&I
- —
- Monthly cashflow
- —
- DSCR
- —
- Eligible?
- —
Personal DTI + credit; lowest rate.
DSCR
20% down · 8.5% · 30yr
- Down + closing
- —
- Monthly P&I
- —
- Monthly cashflow
- —
- DSCR
- —
- Eligible?
- —
No personal income docs; deal must DSCR.
Hard money
10% down · 12.0% · 12mo
- Down + closing
- —
- Monthly P&I
- —
- Monthly cashflow
- —
- DSCR
- —
- Eligible?
- —
Short-term bridge; refi at stabilization.
Rent comps 1 comps
| Address | Beds | Baths | Sqft | Rent | $/sqft | DOM | Units | Dist |
|---|---|---|---|---|---|---|---|---|
| 5709 Fox Ln Emmaus, PA | 3.0 | 3.5 | 2940 | $3,500 | $1.19 | 23d | 1 | 0.49mi |
Listing history 4 events
-
2026-04-22status Pending
-
2026-04-14price $305,000
-
2026-04-09$339,900 Active
-
2025-09-10soldstatus $175,000
ⓘ Source: listings_history table (triggers on properties + properties_extension) + one-shot
backfill from property_details.listing_events for pre-trigger history.
Tax reassessment forecast PA · Partial reset (capped growth)
- Current annual tax
- $3,357 · $280/mo
- Projected year-2 tax
- $4,088 · $341/mo
- Expected delta
- +$731/yr (+$61/mo · 21.8%)
ⓘ Screening estimate from a state-policy table — verify with the county assessor before closing.
Climate risk First Street
- Flood 1/10 Low FEMA zone X (unshaded) · 0% chance over 30 yrs
- Wildfire 5/10 Major
- Heat 4/10 Moderate 7 d/yr ≥99°F today · 15 d/yr by 30 yrs out
- Wind 4/10 Moderate 17% chance of damaging wind over 30 yrs
- Air quality 2/10 Low 1 unhealthy d/yr today · 2 by 30 yrs out
Nearby sold comps map
Loading sold comps map…
Walkable amenities ~0.75 mi
Loading nearby amenities…
Taxation est. · year 1
- Rental income
- $29,856
- − Mortgage interest
- −$17,085
- − Property taxes
- −$3,357
- − Insurance
- −$1,525
- − Repairs & maintenance
- −$2,388
- − Management
- −$2,388
- − Depreciation
- −$8,873
- Taxable loss
- −$5,760
- Est. tax savings @ 24.0%
- +$1,383
- After-tax cash flow
- $893/yr
For passive investors: Depreciation is non-cash, so a rental often shows a tax loss while cash-flowing — sheltering income. Rental losses are passive: they offset passive income freely, and up to $25,000/yr can offset ordinary (W-2) income if you actively participate and your MAGI is under $100k (phasing out to $0 by $150k); unused losses carry forward. On sale, claimed depreciation is recaptured at up to 25%, and gains may owe capital-gains tax (a 1031 exchange can defer both). Figures are a year-1 estimate at your 24.0% rate — not tax advice; consult a CPA.
Schools (NCES district)
- District
- East Penn SD
- NCES district ID
- 4208550
- Math proficiency
- 43% ▼ -11.00%
- Reading proficiency
- 65% ▼ -9.00%
- Median HH income
- $70,679
- Composite
- 47.99/100
- National rank
- #2200
- State rank
- #103 of 539 in PA
Livability — Emmaus
- Score
- 86/100
- State rank
- #61
- US rank
- #424
Category grades
Schools grade is shown separately in the Schools card above.
Census & demographics
- County
- Lehigh County · 333,019 people
- City population
- 18,941
- Metro
- Allentown-Bethlehem-Easton, PA-NJ
- Population (ZIP)
- 18,941
- Household income
- $93,694
- Rent vs Own
- Severe rent burden
- 645.0
Population outlook (Lehigh County) Hauer SSP2
- Today (2025)
- 392,957 people
- By 2030
- 408,319 · +3.9%
- By 2040
- 440,007 · +12.0%
- By 2050
- 475,940 · +21.1%
- By 2075
- 590,448 · +50.3%
- By 2100
- 690,314 · +75.7%
Race, ethnicity, and origin ACS 2023
- Neighborhood character
- Predominantly White (86%)
- Race & ethnicity
- White 86% Hispanic / Latino 8% Two or more races 4% Asian 2% Black 1%
- Hispanic origin (detail)
- Puerto Rican 3%
- Common ancestry
- Romanian 4% Polish 3% Lithuanian 3%
- Foreign-born
- 5% · Canada, South Korea
- Languages at home
- 91% English-only · Spanish 4% Arabic 3% Other Indo-European 1%
Political lean MEDSL · Lehigh
- 2024 margin
- Toss-up / Even · D 50.7% · R 48.0% · Other 1.2%
- 2008→2024 swing
- -12.9pp toward R · 2008: 15.6pp · 2024: 2.7pp
- All cycles
- 2024: D+2.7 2020: D+7.6 2016: D+4.4 2012: D+7.5 2008: D+15.6
Not yet ingested
- Civics
- —
Market trends
- HPI YoY
- ▼ -192.33%
- Current HPI
- 263.1517
- Rent YoY
- ▲ 6.18%
- Metro
- Allentown-Bethlehem-Easton, PA-NJ
- State GDP YoY
- ▲ 1.68%
- F500 in state
- 34
Industry mix (Fortune 500 HQ in PA)
| Industry | F500 HQs | Revenue |
|---|---|---|
| Healthcare | 2 | $309B |
|
||
| Insurance | 2 | $27B |
|
||
| Telecommunications / Media | 1 | $124B |
|
||
| Industrial Distribution | 1 | $22B |
|
||
| Financial Services | 1 | $20B |
|
||
| Chemicals / Materials | 1 | $18B |
|
||
Price history
+74.3% since first listed4 events — show timeline
- 2026-04-22 Pending — BRIGHT MLS
- 2026-04-14 Price Changed $305,000 BRIGHT MLS
- 2026-04-09 Listed $339,900 BRIGHT MLS
- 2025-09-10 Sold (Public Records) $175,000 Public Records
Property tax history
+2.3%/yrLatest (2026): $3,357 · +3.3% YoY. Source: county tax records.
Cash-flow waterfall
monthlySold comps — $/sqft
last 12 mo · ≤1 miLoading sold comps…