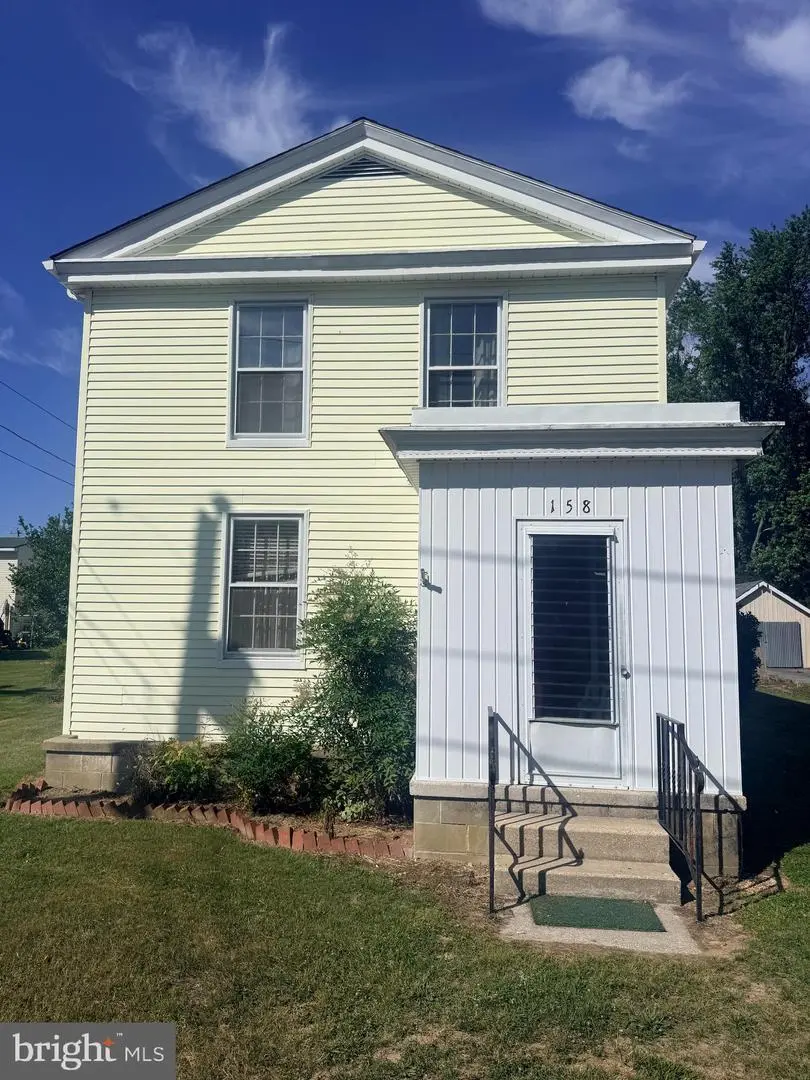
158 Wright St
Preston, MD 21655
$260,000D+
3 bd · 2.0 ba ·
1,840 sqft ·
Built 1890
· SingleFamily
· Active
· 15 DOM
Cashflow @ list (25.0% down · 7.5%)
Estimated rent
$1,876/mo
Mortgage (P&I)
−$1,363
Tax + insurance
−$304
HOA
−$0
Vac / Maint / Mgmt
−$394
Net cashflow
$-185/mo
Annual
$-2,224/yr
Cap rate
5.44%
Cash-on-cash
-3.06%
DSCR
0.86
1% rule
0.72%
Cash to close
$72,800
Investor read
- This is a 3-bed/2.0-bath single-family listed at $260k.
- At list price, monthly cash flow is $-185 ($-2k/yr) — negative.
- To cash-flow at today's rent, offer at most $227k (12.6% below list).
- To meet the 1% rule (rent ≥ 1% of price), the offer needs to be $188k (27.8% below list).
- It's been on market 15 days — a 2% lower offer ($256k) is reasonable based on typical stale-listing flexibility.
- Recommended offer: $188k (27.8% below list) — sets the bar for 1% rule.
- In year one you build about $27k of equity ($2k loan paydown + $25k appreciation (9.6% local appreciation)).
- Location reads 66/100 on livability (#245 in MD) — a middle-class / working-renter tenant base. Strengths: housing A+, health & safety A+, cost of living B+; Watch: schools C-, crime F, amenities F.
- Caroline County Public Schools (rural): math 13% / reading 29% proficiency, ranked #17 of 24 in MD (top 71%) — low school quality limits family demand, transient renter base, plan for 1-2y turnover.
- Watch-outs: built in 1890 — expect roof / HVAC / electrical / plumbing capex.
- Market conditions: 36 active listings in the ZIP; 59 units permitted in Caroline County in 2024 (0 in 5+ unit buildings).
- Caroline County population projected at -19% by 2050 — secular population decline; favor cash flow + early exit over multi-decade hold.
- 2 sale attempts with the ask held roughly flat each time — persistent listings suggest the price (not the market) is what's stuck; bring a comps-based counter.
- By year 2, paydown + projected appreciation supports a ~$43k cash-out refi (75% LTV) — recoverable capital for the next deal without selling this one.
- Climate carrying-cost: major wind risk, 63% chance of damaging wind over 30y; extreme-heat days projected 7→16/yr by 2055 (HVAC capex compounding) — expect insurance premiums to compound above CPI over the hold.
- Cap rate 5.4% vs local median 4.5% in Preston — meaningfully above typical; check what's discounted (condition, days-on-market, listing class) to confirm the premium yield is real.
Questions for listing agent
- What do current leases actually rent for vs. the listed asking? Can we see a recent rent roll and the last 12 months of T-12 income?
- Built in 1890 — when were the roof, HVAC, electrical panel, plumbing, and water heater last replaced?
- Is there a deadline driving the sale (1031 exchange, divorce, estate, relocation)? That informs how much negotiation room exists.
- Crime grade is F in this area — have there been break-ins, vandalism, or insurance claims at this property in the last 3 years? What carrier currently insures it and at what premium?
- The area grade is low — what's the realistic commute time and amenity access for the typical tenant pool here? Any planned neighborhood developments (good or bad) we should know about?
- What's the average days-on-market for RENTAL listings here right now (not sales)? A rising rental-DOM trend means longer vacancies and softer asking-rent achievability than the comps imply.
- What's the recent tenant-quality profile in this submarket — average credit score on applications, eviction rate, late-payment / NSF rate, and stable-employment percentage? A property-management company in the area should have these aggregated.
- How much new for-sale + rental construction is in the pipeline within 1–3 miles? Heavy new supply typically softens prices + rents 12–24 months out; constrained supply supports both.
CashFlowRE · CFR-ANFJ3B705CZ7TH
· Data 2 days ago
cashflowre.app · 2026-05-29