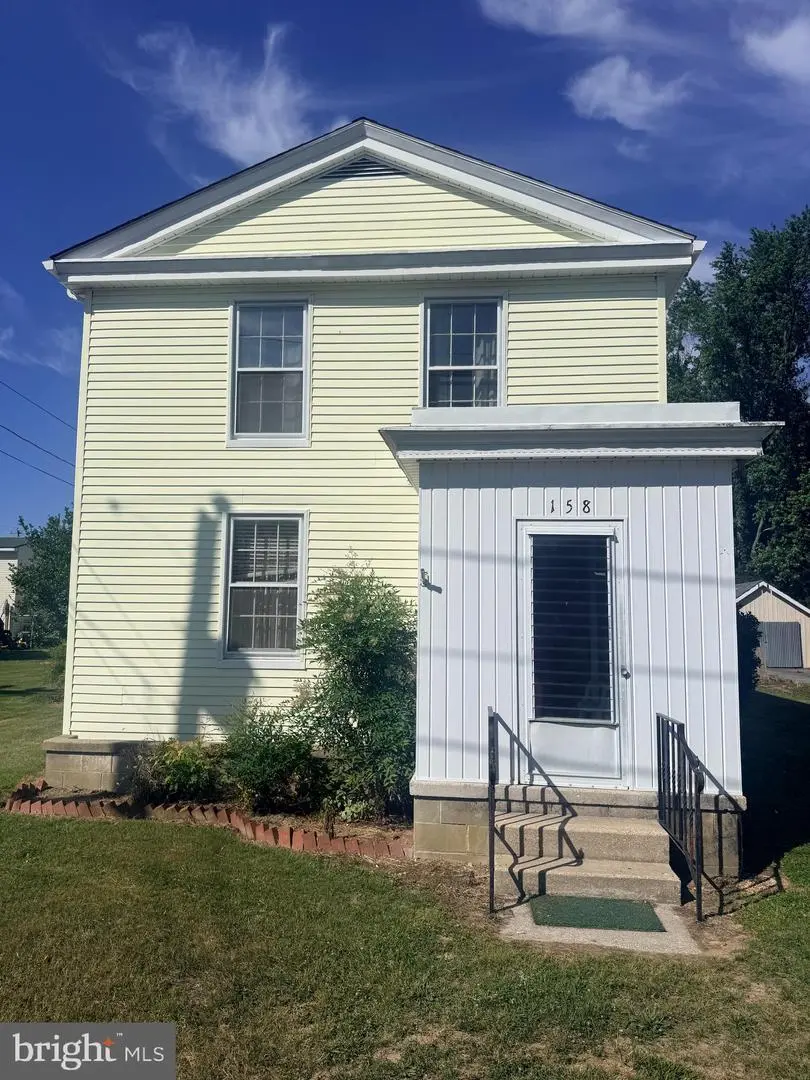
158 Wright St · Preston, MD
Flood risk 1/10 · Minimal
- FEMA flood zone
- X (unshaded)
- Chance of flooding over 30 yrs
- 0.0%
- Est. flood insurance / yr
- $507 – $1,088
Fire risk 1/10 · Minimal
- Est. fire insurance / yr
- $755 – $1,403
Heat risk 9/10 · Severe
- Hot days now (above 104°F)
- 7 days/yr
- Hot days in 30 yrs
- 16 days/yr
Wind risk 6/10 · Moderate
- Chance of severe wind over 30 yrs
- 63.0%
Air-quality risk 3/10 · Minor
- Unhealthy air days now
- 2 days/yr
- Unhealthy air days in 30 yrs
- 3 days/yr
Risk factors via First Street. Map © Google.
Why this score? — see what drove the D+ grade
The composite is a weighted blend of 9 inputs, each scored 0–100. Each bar is that input's sub-score; the figure is the points it added to the 100-point composite (weight × sub-score).
- ARV discount +15.0/15.0
- Appreciation +9.8/10.0
- Cash flow +9.4/30.0
- Livability +3.3/5.0
- DSCR +2.6/10.0
- Rent growth +2.5/5.0
- Condition / age +2.5/5.0
- 1% rule +2.2/10.0
- Schools +1.9/10.0
$260,000
🖨 Deal sheet 📄 Offer letter ✓ Due diligence
Listing remarks
Step back in time with this charming 3-bedroom, 2-bathroom home built in 1890, located in the heart of Preston. Full of character and original details, this home offers a unique opportunity to restore and customize a piece of local history. The inviting living room features a cozy fireplace, perfect for relaxing evenings. A large laundry room and a separate den/office provide flexibility and extra space for modern living. Outside, you’ll find an oversized shop/garage ideal for hobbies, storage, or a workshop. The property also includes a home generator, adding peace of mind. The generator just had it's annual service completed. New carpet was just put in upstairs. While the home does
Key facts
- Oversized shop
- Home generator
- Separate den
Tags
Property features AI
Finance
- Other: Ownership: fee simple
Exterior
- Parking: Driveway
- Utilities: Public water; Public sewer; Electric hot water
- Home design: Detached home; Estimated year built
- Construction: Aluminum siding; Permanent foundation; Above-grade and below-grade structures
- Exterior features: Property located within city limits of Preston; Directions: main st preston turn onto Chambers St, Turn right onto Wright st. Home on the left
Interior
- Bedrooms: Three bedrooms on the upper level
- Bathrooms: Two full bathrooms (one on the main level and one on the upper level)
- Heating & cooling: Baseboard hot water heating; Window air conditioning units (electric)
- Interior features: Estimated living area; Has one fireplace; No basement; Two or more access exits
Neighborhood map
What this means for you Summary
Snapshot
- This is a 3-bed/2.0-bath single-family listed at $260k.
Deal economics
- At list price, monthly cash flow is $-185 ($-2k/yr) — negative.
- To cash-flow at today's rent, offer at most $227k (12.6% below list).
- To meet the 1% rule (rent ≥ 1% of price), the offer needs to be $188k (27.8% below list).
- Recommended offer: $188k (27.8% below list) — sets the bar for 1% rule.
- Cap rate 5.4% vs local median 4.5% in Preston — meaningfully above typical; check what's discounted (condition, days-on-market, listing class) to confirm the premium yield is real.
Location & tenants
- Location reads 66/100 on livability (#245 in MD) — a middle-class / working-renter tenant base. Strengths: housing A+, health & safety A+, cost of living B+; Watch: schools C-, crime F, amenities F.
- Caroline County Public Schools (rural): math 13% / reading 29% proficiency, ranked #17 of 24 in MD (top 71%) — low school quality limits family demand, transient renter base, plan for 1-2y turnover.
- Market conditions: 36 active listings in the ZIP; 59 units permitted in Caroline County in 2024 (0 in 5+ unit buildings).
Forward outlook
- In year one you build about $27k of equity ($2k loan paydown + $25k appreciation (9.6% local appreciation)).
- Caroline County population projected at -19% by 2050 — secular population decline; favor cash flow + early exit over multi-decade hold.
- By year 2, paydown + projected appreciation supports a ~$43k cash-out refi (75% LTV) — recoverable capital for the next deal without selling this one.
Negotiation context
- It's been on market 15 days — a 2% lower offer ($256k) is reasonable based on typical stale-listing flexibility.
- 2 sale attempts with the ask held roughly flat each time — persistent listings suggest the price (not the market) is what's stuck; bring a comps-based counter.
Risks & watch-outs
- Watch-outs: built in 1890 — expect roof / HVAC / electrical / plumbing capex.
- Climate carrying-cost: major wind risk, 63% chance of damaging wind over 30y; extreme-heat days projected 7→16/yr by 2055 (HVAC capex compounding) — expect insurance premiums to compound above CPI over the hold.
Questions for the listing agent
- What do current leases actually rent for vs. the listed asking? Can we see a recent rent roll and the last 12 months of T-12 income?
- Built in 1890 — when were the roof, HVAC, electrical panel, plumbing, and water heater last replaced?
- Is there a deadline driving the sale (1031 exchange, divorce, estate, relocation)? That informs how much negotiation room exists.
- Crime grade is F in this area — have there been break-ins, vandalism, or insurance claims at this property in the last 3 years? What carrier currently insures it and at what premium?
- The area grade is low — what's the realistic commute time and amenity access for the typical tenant pool here? Any planned neighborhood developments (good or bad) we should know about?
- What's the average days-on-market for RENTAL listings here right now (not sales)? A rising rental-DOM trend means longer vacancies and softer asking-rent achievability than the comps imply.
- What's the recent tenant-quality profile in this submarket — average credit score on applications, eviction rate, late-payment / NSF rate, and stable-employment percentage? A property-management company in the area should have these aggregated.
- How much new for-sale + rental construction is in the pipeline within 1–3 miles? Heavy new supply typically softens prices + rents 12–24 months out; constrained supply supports both.
Investment metrics
- 1% rule
- 0.72% ✗
- Cap rate
- 5.44%
- Cash-on-cash
- -3.06%
- DSCR
- 0.86
- GRM
- 11.5
CMA / ARV
- ARV (on-the-fly)
- $320,160
- Comps found
- 3
Show comp detail 3 sales within ~0.75 mi
| Address | Dist | Beds/Ba | Sqft | Sold | Price | $/sf | Match |
|---|---|---|---|---|---|---|---|
| 221 Apple Ln | 0.43mi | 4/2.0 (+1) | 1,700 (-8%) | 0mo | $355,000 | $209 | 62 |
| 3622 Choptank Rd | 0.37mi | 2/1.5 (-1) | 1,700 (-8%) | 6mo | $295,900 | $174 | 59 |
| 111 Fooks Ave | 0.30mi | 4/2.0 (+1) | 2,072 (+13%) | 23mo | $335,000 | $162 | 41 |
Match score weights: distance 35% · size 25% · config 20% · recency 20%. Top-matched comps best support the ARV.
Projected returns pro-forma
9.58% appreciation · 3.0% rent growth · sell at horizon
- IRR
- 21.2%
- Equity multiple
- 2.68×
- Total profit
- $122,322
- Equity at exit
- $226,331
- IRR
- 19.2%
- Equity multiple
- 6.05×
- Total profit
- $367,577
- Equity at exit
- $479,925
Cash invested: $72,800 (down + closing). Projections, not guarantees.
Landlord ↔ Tenant lean methodology
- Overall (STATE)
- 27 Tenant-Leaning
- State Maryland
- 27 Tenant-Leaning · D+14
- County
- — inherits STATE
- City
- — inherits STATE
ZIP-level market 21655
- Home prices YoY
- 3.1%
- Active inventory
- 36
- Price-to-rent
- 11.5×
Monthly cashflow live
- Estimated rent
- $1,876 medium interval (Pro) →
- Mortgage (P&I)
- −$1,363
- Tax from tax record
- −$196 /mo · $2,348/yr
- Insurance
- −$108
- HOA
- −$0
- Vacancy / Maint / Mgmt
- −$394
- Net cashflow
- $-185
Break-even live
UW: 25.0% down · 7.5% · 30yr · 1.5% tax · 5.0% vac · 8.0% maint · 8.0% mgmt
Financing live
Cash to close
- Down payment
- $65,000
- Closing costs
- $7,800
- Reserves months
- —
- Total cash needed
- —
Loan-product check · same deal, 3 products live
Conventional
25% down · 7.5% · 30yr
- Down + closing
- —
- Monthly P&I
- —
- Monthly cashflow
- —
- DSCR
- —
- Eligible?
- —
Personal DTI + credit; lowest rate.
DSCR
20% down · 8.5% · 30yr
- Down + closing
- —
- Monthly P&I
- —
- Monthly cashflow
- —
- DSCR
- —
- Eligible?
- —
No personal income docs; deal must DSCR.
Hard money
10% down · 12.0% · 12mo
- Down + closing
- —
- Monthly P&I
- —
- Monthly cashflow
- —
- DSCR
- —
- Eligible?
- —
Short-term bridge; refi at stabilization.
Listing history 12 events
-
2026-06-18days on market $260,000 Active 15 DOM
-
2026-06-17days on market $260,000 Active 14 DOM
-
2026-06-16days on market $260,000 Active 13 DOM
-
2026-06-15days on market $260,000 Active 12 DOM
-
2026-06-13days on market $260,000 Active 10 DOM
-
2026-06-12days on market $260,000 Active 9 DOM
-
2026-06-09days on market $260,000 Active 6 DOM
-
2026-06-08days on market $260,000 Active 5 DOM
-
2026-06-07days on market $260,000 Active 4 DOM
-
2026-06-07days on market $260,000 Active 3 DOM
-
2026-06-04remarks 693-char remark
-
2026-06-04$260,000 Active 1 DOM
ⓘ Source: listings_history table (triggers on properties + properties_extension) + one-shot
backfill from property_details.listing_events for pre-trigger history.
Tax reassessment forecast MD · Partial reset (capped growth)
- Current annual tax
- $2,348 · $196/mo
- Projected year-2 tax
- $2,591 · $216/mo
- Expected delta
- +$243/yr (+$20/mo · 10.4%)
ⓘ Screening estimate from a state-policy table — verify with the county assessor before closing.
Climate risk First Street
- Flood 1/10 Low FEMA zone X (unshaded) · 0% chance over 30 yrs
- Wildfire 1/10 Low
- Heat 9/10 Extreme 7 d/yr ≥104°F today · 16 d/yr by 30 yrs out
- Wind 6/10 Major 63% chance of damaging wind over 30 yrs
- Air quality 3/10 Moderate 2 unhealthy d/yr today · 3 by 30 yrs out
Nearby sold comps map
Loading sold comps map…
Walkable amenities ~0.75 mi
Loading nearby amenities…
Taxation est. · year 1
- Rental income
- $22,513
- − Mortgage interest
- −$14,564
- − Property taxes
- −$2,348
- − Insurance
- −$1,300
- − Repairs & maintenance
- −$1,801
- − Management
- −$1,801
- − Depreciation
- −$7,564
- Taxable loss
- −$6,865
- Est. tax savings @ 24.0%
- +$1,648
- After-tax cash flow
- $-577/yr
For passive investors: Depreciation is non-cash, so a rental often shows a tax loss while cash-flowing — sheltering income. Rental losses are passive: they offset passive income freely, and up to $25,000/yr can offset ordinary (W-2) income if you actively participate and your MAGI is under $100k (phasing out to $0 by $150k); unused losses carry forward. On sale, claimed depreciation is recaptured at up to 25%, and gains may owe capital-gains tax (a 1031 exchange can defer both). Figures are a year-1 estimate at your 24.0% rate — not tax advice; consult a CPA.
Schools (NCES district)
- District
- Caroline County Public Schools
- NCES district ID
- 2400180
- Math proficiency
- 13% ▼ -22.00%
- Reading proficiency
- 29% ▼ -14.00%
- Median HH income
- $55,076
- Composite
- 19.16/100
- National rank
- #8823
- State rank
- #17 of 24 in MD
Livability — Preston
- Score
- 66/100
- State rank
- #245
- US rank
- #12172
Category grades
Schools grade is shown separately in the Schools card above.
Census & demographics
- Census place
- Preston, MD
- Population (ZIP)
- 4,995
Population outlook (Caroline County) Hauer SSP2
- Today (2025)
- 31,205 people
- By 2030
- 30,204 · -3.2%
- By 2040
- 27,866 · -10.7%
- By 2050
- 25,342 · -18.8%
- By 2075
- 20,554 · -34.1%
- By 2100
- 17,415 · -44.2%
Race, ethnicity, and origin ACS 2023
- Neighborhood character
- Predominantly White (79%)
- Race & ethnicity
- White 79% Black 10% Two or more races 7% Hispanic / Latino 2%
- Common ancestry
- Slovak 2% Italian 1% Romanian 1%
- Foreign-born
- 1%
- Languages at home
- 98% English-only · Other Indo-European 1%
Political lean MEDSL · Caroline
- 2024 margin
- Solid R (+38.0) · D 29.9% · R 67.9% · Other 2.2%
- 2008→2024 swing
- -15.0pp toward R · 2008: -23.0pp · 2024: -38.0pp
- All cycles
- 2024: R+38.0 2020: R+32.9 2016: R+39.5 2012: R+24.4 2008: R+23.0
Not yet ingested
- Civics
- —
Market trends
- HPI YoY
- ▲ 9.58%
- Current HPI
- 319.9345
- Rent YoY
- —
- Metro
- —
- State GDP YoY
- ▲ 2.97%
- F500 in state
- 12
Industry mix (Fortune 500 HQ in MD)
| Industry | F500 HQs | Revenue |
|---|---|---|
| Aerospace / Defense | 1 | $71B |
|
||
| Utilities | 1 | $25B |
|
||
| Hotels | 1 | $24B |
|
||
| Consumer Goods | 1 | $7B |
|
||
| Real Estate | 1 | $6B |
|
||
| Chemicals | 1 | $2B |
|
||
Price history
-1.9% since first listed7 events — show timeline
- 2026-06-03 Listed $260,000 BRIGHT MLS
- 2026-02-09 Listing Removed — BRIGHT MLS
- 2026-01-14 Price Changed $225,000 BRIGHT MLS
- 2026-01-14 Price Changed $200,000 BRIGHT MLS
- 2025-11-03 Price Changed $245,000 BRIGHT MLS
- 2025-08-22 Listed $265,000 BRIGHT MLS
- 2025-08-04 Coming Soon — BRIGHT MLS
Property tax history
+4.2%/yrLatest (2025): $2,348 · +6.0% YoY. Source: county tax records.
Cash-flow waterfall
monthlySold comps — $/sqft
last 12 mo · ≤1 miLoading sold comps…