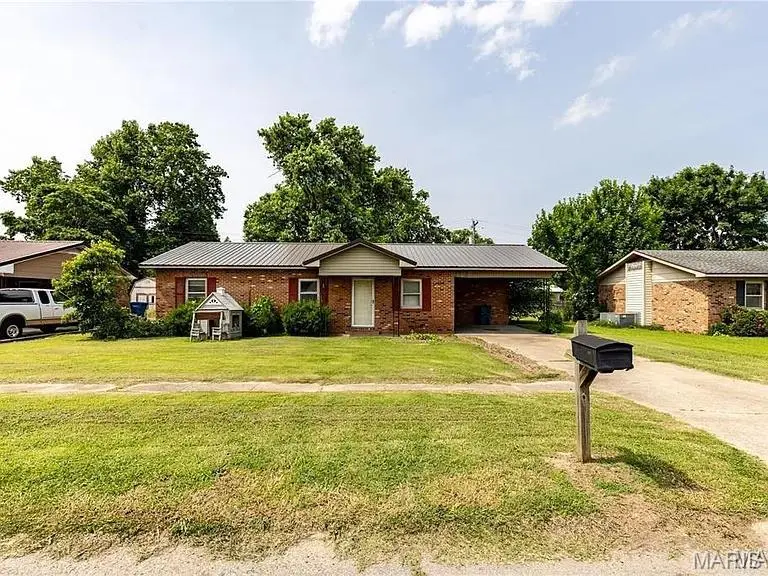
141 Saint Catherine
New Madrid, MO 63869
$99,900C
3 bd · 1.0 ba ·
1,233 sqft ·
Built 1978
· Other
· Active
· 7 DOM
Cashflow @ list (25.0% down · 7.5%)
Estimated rent
$907/mo
Mortgage (P&I)
−$524
Tax + insurance
−$104
HOA
−$0
Vac / Maint / Mgmt
−$191
Net cashflow
$89/mo
Annual
$1,062/yr
Cap rate
7.36%
Cash-on-cash
3.80%
DSCR
1.17
1% rule
0.91%
Cash to close
$27,972
Investor read
- This is a 3-bed/1.0-bath other listed at $100k.
- At list price, monthly cash flow is $89 ($1k/yr) — positive.
- The deal already cash-flows at list — no discount required.
- To meet the 1% rule (rent ≥ 1% of price), the offer needs to be $91k (9.2% below list).
- Only 7 days on market — expect competitive offers; lowballing is unlikely to land.
- Recommended offer: $91k (9.2% below list) — sets the bar for 1% rule.
- In year one you build about $11k of equity ($691 loan paydown + $10k appreciation (10.0% local appreciation)).
- Location reads 64/100 on livability (#309 in MO) — a middle-class / working-renter tenant base. Strengths: cost of living A+, housing B+; Watch: health & safety C-, crime D, amenities F.
- New Madrid County R-I (rural): math 20% / reading 31% proficiency, ranked #291 of 324 in MO (top 90%) — low school quality limits family demand, transient renter base, plan for 1-2y turnover; 63% free/reduced lunch — lower-income household profile, screen leases tightly.
- Zoned schools: New Madrid Elementary (math 37% / reading 32%, grade F, #676 of 1,115 statewide, top 66%, 280 students, 100% FRL); Central High School (math 2% / reading 32%, grade F, #483 of 521 statewide, top 93%, 400 students, 100% FRL) — zoned schools average 100% FRL vs 63% district-wide (37 pts higher); higher-poverty schools than district average — tighter screening recommended.
- Market conditions: 15 active listings in the ZIP; 11 units permitted in New Madrid County in 2024 (0 in 5+ unit buildings).
- New Madrid County population projected at -25% by 2050 — secular population decline; favor cash flow + early exit over multi-decade hold.
- 2 sale attempts with the ask held roughly flat each time — persistent listings suggest the price (not the market) is what's stuck; bring a comps-based counter.
- At projected returns (10.0% appreciation + 3.0% rent growth), your $28k cash investment doubles in ~3 years — after that, you're playing with house money.
- By year 4, paydown + projected appreciation supports a ~$38k cash-out refi (75% LTV) — recoverable capital for the next deal without selling this one.
- Climate carrying-cost: extreme-heat days projected 7→22/yr by 2055 (HVAC capex compounding) — expect insurance premiums to compound above CPI over the hold.
Questions for listing agent
- Built in 1978 — when were the roof, HVAC, electrical panel, plumbing, and water heater last replaced?
- Is there a deadline driving the sale (1031 exchange, divorce, estate, relocation)? That informs how much negotiation room exists.
- Schools are F-rated, which usually means shorter tenancies and higher turnover. Who's the typical renter profile here, and what's been the actual vacancy rate?
- Crime grade is D in this area — have there been break-ins, vandalism, or insurance claims at this property in the last 3 years? What carrier currently insures it and at what premium?
- What's the average days-on-market for RENTAL listings here right now (not sales)? A rising rental-DOM trend means longer vacancies and softer asking-rent achievability than the comps imply.
- What's the recent tenant-quality profile in this submarket — average credit score on applications, eviction rate, late-payment / NSF rate, and stable-employment percentage? A property-management company in the area should have these aggregated.
- How much new for-sale + rental construction is in the pipeline within 1–3 miles? Heavy new supply typically softens prices + rents 12–24 months out; constrained supply supports both.
CashFlowRE · CFR-AP2GVQ30YCPF5T
· Data 2 days ago
cashflowre.app · 2026-05-29